Table of Contents
Report
Title
- Smart Companion Pillow
![]()
Authors:
- Alexandre Reis;
- Elien Gielen;
- Ko Wopereis;
- Marcel Pasternak;
- Tobias Schneider;
- Vaido Sooäär.
Acknowledgements
Teachers and Supervisors who did their very best to the success of this project.
Sponsors: A Central da Borracha (pillow foam); Departamento de Engenharia Electrotécnica (DEE), ISEP (electronic components); Departamento de Física (DFI), ISEP (electronic components); Flexitex (pillow and sock cover), Molarte (zippers, velcro and labour to build the pillow); Laboratório de Sistemas Autónomos (LSA), ISEP (raw material and the use of a 3D printer); SOLIUS (electronic components).
Supporters: Citeve (technical support on advanced textiles); Fibran (pillow thermal insulation board); LMA - Leandro Manuel Araújo, S.A. (waterproof but not airproof textile to protect the electronic components of the pillow and the sock from spillage of liquids).
Glossary
| Abbreviation | Description |
|---|---|
| 2D | Two-dimensional |
| 3D | Three-dimensional |
| app | application |
| AAP | American Academy of Pediatrics |
| AAL | Ambient Assisted Living |
| ABC | Automatic Baseline Calibration |
| AC | Alternative Current |
| ABS | Acrylonitrile Butadiene Styrene |
| ASHRAE | American Society of Heating, Refrigerating and Air-Conditioning Engineers |
| B2C | Business to Consumer |
| BLE | Bluetooth Low Energy |
| Brexit | Shorthand way of saying the UK leaving the EU - merging the words Britain and exit to get Brexit |
| BT | Bluetooth |
| BPM | Beats Per Minute |
| Cd | Cadmium |
| CIA | Central Intelligence Agency |
| CO | Carbon Monoxide |
| CO2 | Carbon Dioxide |
| CPU | Central Processing Unit |
| CS2 | Carbon Disulfide |
| dB | Decibel |
| DC | District of Columbia |
| DfD | Design for Disassembly |
| DEE | Departamento de Engenharia Electrotécnica |
| DFI | Departamento de Física |
| ECG | Electrocardiography |
| eCO2 | equivalent Carbon Dioxide |
| EPS | European Project Semester |
| EU | European Union |
| FAAP | Fellow of the American Academy of Pediatrics |
| FDA | Food and Drug Administration |
| FTDI | Future Technology Devices International |
| GDP | Gross Domestic Product |
| H2 | Hydrogen |
| HD | High Definition |
| HSO4 | Hydrogen Sulfate |
| I2C | Inter-Integrated Circuit |
| I3S | Instituto de Investigação e Inovação da Universidade do Porto |
| IBI | Interbeat Interval |
| IC | Integrated Circuit |
| ICT | Information, Communication and Technology |
| IEC | International Electrotechnical Commission |
| IFTTT | If This Then That |
| IoT | Internet of Things |
| ISR | Interrupt Service Routine |
| ISEP | Instituto Superior de Engenharia do Porto |
| ISO | International Organization for Standardization |
| LED | Light Emitting Diode |
| LSA | Laboratório de Sistemas Autónomos |
| MD | Medical Doctor |
| MDR | Medical Device Regulation |
| MOX | Metal Oxide Semiconductor |
| MP3 | MPEG-1 Audio Layer 3 |
| MPEG | Moving Picture Experts Group |
| NaOH | Sodium Hydroxide |
| NHS | National Health System |
| NICHD | National Institute of Child Health and Human Development |
| NIOSH | National Institute for Occupation Safety and Health |
| NSP | National Sleep Foundation |
| NSPE | National Society of Professional Engineers |
| NTC | Negative Temperature Coefficient |
| P | Procedure |
| Pb | Lead |
| PBI | Product Backlog Item |
| PDCA | Plan, Do, Check, Act |
| PESTEL | Political, Economic, Socio-Cultural, Technological, Environmental and Legal |
| PET | Polyethylene Terephthalate |
| ppb | parts per billion |
| ppm | parts per million |
| PPS | Purchasing Power Standards |
| PU | Polyurethane |
| Q-S | Quantified Self |
| REM | Rapid Eye Movement |
| RH | Relative Humidity |
| ROHS | Restriction of Hazardous Substances |
| SIDS | Sudden Infant Death Syndrome |
| SMART | Specific Measurable Achievable Relevant and Time-related |
| SMARTER | Specific Measurable Achievable Relevant and Time-related Evaluated Reviewed |
| SMEI | Sales & Marketing Executives International |
| SOUP | Software Of Unknown Provenance |
| SpO2 | Peripheral Oxygen Saturation |
| SRAM | Static Random Access Memory |
| SSID | Service Set Identifier |
| SWOT | Strenghs Weaknesses Opportunities Threats |
| TLC | Central Limit Theorem |
| TPU | Thermoplastic Polyurethane |
| TVOC | Total Volatile Organic Compounds |
| UNESCO | United Nations Educational, Scientific and Cultural Organization |
| UNICEF | United Nations Children´s Fund |
| UK | United Kingdom |
| USA | United States of America |
| USB | Universal Serial Bus |
| USP | Unique Selling Point |
| VOC | Volatile Organic Compound |
| WBS | Work Breakdown Structure |
| XPS | Extruded Polystyrene |
1. Introduction
In the European Project Semester (EPS) students from different countries and courses of studies are working together to develop a new product. In this chapter, the team members are introduced and a first overview of the project is given.
1.1 Presentation
This team is part of the European Project Semester (EPS) at Instituto Superior de Engenharia do Porto (ISEP). One of the big challenges in the EPS is the diversity of the team. The team members are coming from five different countries and five different scientific fields. Therefore, it is important to find a team spirit. Moreover, it is a great experience to learn from each other and get an insight into the work behaviour of each nation. Table 1 sums up the background of each team member, and Figure 1 portraits them.
| Name | Alexandre Reis | Marcel Pasternak | Tobias Schneider | Elien Gielen | Ko Wopereis | Vaido Sooäär |
|---|---|---|---|---|---|---|
| Nationality | Portuguese | German | German | Belgian | Dutch | Estonian |
| Course of study | Mechanical Engineering | Mechanical Engineering | Biomedical Engineering | Product Development | Industrial Product Engineering | Electrical Engineering |

1.2 Motivation
In the 2019's EPS edition at ISEP, the team develops a Smart Companion Pillow for babies. For all the team members it is a new experience to work in a big group of people with different cultural and knowledge background. So the motivation of taking part in the EPS is to learn from each other and find the team spirit which is needed to create a Smart Companion Pillow. Moreover, each team member wants to improve English skills in a scientific way. The motivation for the project is to create an object that supports people to be healthy. Therefore, the team is motivated to develop a product that will help people in a part of their lives. With the rise of using sensors as a part of the IoT [1], it is very interesting to see how to manage the amount of data and how it can contribute for improving both parents' and babies' well-being.
1.3 Problem
Parents are always worried about the health of their children. According to the American Academy of Pediatrics (AAP) the Sudden Infant Death Syndrome (SIDS) is still an unsolved problem in our world [2]. Therefore the team created a product that either has the benefit of stress relief for the parents or it lowers the risk of SIDS giving the baby the best possible environment to grow up in. In the smart world, parents should be able to make sure the baby is alright by measuring vital parameters and taking care of them with an application (app).
1.4 Objectives
The main goal of the product is the stress relief for the parents during the first 24 months of having a baby. Therefore, the smart pillow monitors the baby's health and the environment. Furthermore, the gadget prevents the infant from lying on its tummy and reacts to its voice/noise with reassuring sounds. For all the objectives the team keeps attention to sustainable and ethical practices.
1.5 Requirements
There are several requirements the team has to take care of. In this section, the main requirements of the project are listed. Functional requirements - The prototype of the pillow has to collect and monitor the sensor data.
Usability requirements - The data has to be presented in a clear way (mobile application/ browser).
Environmental requirements - The project has to be based on the 3 Pillars of Sustainability [3], the 12 Principles of Green Engineering [4], the United Nations Educational, Scientific and Cultural Organization (UNESCO) 17 Sustainable Development Goals [5] and on a Life Cycle Analysis [6].
Limitations - Use a maximum budget of 100.00 € to built a prototype, low-cost hardware solutions and open source software.
Technical requirements - Comply with the following European Union (EU) Directives:
- Machine Directive (2006/42/EC 2006-05-17) [7];
- Low Voltage Directive (2014/35/EU 2016-04-20) [8];
- Radio Equipment Directive (2014/53/EU 2014-04-16) [9];
- Restriction of Hazardous Substances (ROHS) in Electrical and Electronic Equipment Directive (2002/95/EC 2003-01-27) [10];
- Electromagnetic Compatibility Directive (2004/108/EC 2004 12 15) [11].
1.6 Functional Tests
In order to examine the final function of the prototype, the team has to test the software and the hardware aspects which are connected with our objectives as follows. The planned Functional Tests concern the physical product itself, the software and the hardware. Table 2 lists the planned functional tests highlighting their purpose and the validation.
| Item | Purpose | Verification |
|---|---|---|
| Software | ||
| Sensors | Test the related software of the sensors | Upload a code example with the Arduino IDE software |
| IoT Cloud | Create graphs with an open source IoT cloud on a website | Send the measured values to the IoT cloud via Wi-Fi |
| Interaction | React to the crying of the baby with sounds | Write a code to notice the noise of the baby with the microphone sensor and play sounds through the speakers with the MP3 player |
| Hardware | ||
| Sensors/Jumper Wires/Micro-controllers | Be sure that the delivered components are working | Upload a code example with the Arduino IDE software |
| Bluetooth/Wi-Fi | Proove that the Bluetooth and Wi-Fi are working | Upload a code example with the Arduino IDE software |
| Battery | Proove that the battery is working | Connect the battery to the micro-controller |
| Speaker | Proove that the speaker is working | Upload a code example with the Arduino IDE software |
| MP3 player | Proove that the MP3 player plays the music through the speaker | Upload a code example with the Arduino IDE software |
1.7 Project Planning
The project is planned in an agile way. Therefore, the team is using the Scrum method. Figure 2 shows the general process implied in Scrum. First of all the team creates the Product Backlog, which is also known as Project Backlog. This includes all features of the product described from the end user's point of view and the tasks the team is working on during the project. After that, the team decides the priority of each feature and divides it into tasks.
A Sprint is a constant limited time, during which the team is working on different tasks. Throughout the project, the period of the sprint is a week. The organization of the teams' Sprint happens during Sprint Planning. All the team members are assigned to the different tasks they want to do in the following Sprint and write it down in the Sprint Backlog. During the Sprint there are Daily Scrums (Daily Stand Up Meetings). They are organized by the Scrum Master. The team members are telling others, what they have done the last day and what they will do in the next 24 hours. The duration of the Daily Stand Up Meeting is very short. It is about 15 minutes.
At the end of every Sprint, there is the Sprint Review and the Sprint Retrospective. During the Sprint Review, the team discusses which tasks were done and which tasks need to be continued in the next Sprint. In the Sprint Retrospective, the team discusses what went well and what could be improved in the next sprints. Finally, the next Sprint is starting again with all the included tasks. This progress will be continued until the project ends.

1.8 Report Structure
This report is structured in eight chapters, detailed in Table 3.
| Chapter | Title | Description |
|---|---|---|
| 1 | Introduction | Introduce the team, the motivation and the objectives of the project |
| 2 | State of the Art | Research of different products on the market and scientific studies |
| 3 | Project Management | Documentation of the progress in the agile management method SCRUM |
| 4 | Marketing Plan | The main objectives are the marketing strategy, target and advertising |
| 5 | Eco-efficiency Measures for Sustainability | All the necessary tasks to make the project sustainable |
| 6 | Ethical and Deontological Concerns | Analysis of the ethical challenges and their solutions |
| 7 | List of Requirements | Product requirements document and the table list of requirements |
| 8 | Product Development | The design of the concept, architecture, components, materials and the functional tests of the prototype |
| 9 | Conclusion | Discussion of the results and the view in the future |
The background studies, which included a scientific research and a survey on existing solutions, are framed in the next chapter.
2. State of the Art
2.1 Introduction
A Smart Companion Pillow helps people with monitoring and also providing interaction. But it is not clear, for which target group the pillow can offer the best support. For this reason, it is essential to research on this matter and create an overview in the form of a State of the Art analysis.
Firstly, to get a vision of possible benefits and target groups, a scientific research of different studies and statistics was made. According to a study from Kinney HC and Thach BT in 2009, the frequency of child death due to SIDS is 1 out of 1000-10000 [13]. Referred to the same study and to the National Institute of Child Health and Human Development (NICHD) of the United States of America (USA) from 2013, the biggest risk factors of SIDS are sleeping on the stomach or side, overheating, exposure to tobacco smoke and bed sharing. It also states that the likelihood of sudden child death is greatest in the first year of life [14].
Sleeping on the back has been found to reduce the risk of SIDS as Mitchell EA published in 2009 [15]. It is thus recommended by AAP. According to studies from Mitchell EA of 2009 as well as Moon RY and Fu L in 2012, sleeping on the back does not appear to increase the risk of choking even in those with gastroesophageal reflux disease while infants in this position may sleep more lightly this is not harmful [16]. Lying on the tummy is healthy and important for babies to strengthen the baby’s musculature but should only be done with parental observation and is not recommended for sleeping.
Another study from Moon RY and Fu L. approves and recommends room sharing but no bed sharing for the first year of the infant [17].
Rachel Y. Moon [18], expounded in her study published in the AAP News and Journals Gateway that air quality and the abstinence of tobacco smoke and other volatile gases like formaldehyde are important for ideal child growth. Nicotine and derivatives cause significant alterations in fetal and newborn neurodevelopment as a study of Lavezzi AM, Corna MF, Matturri L [19] in 2010 substantiated. The NICHD approved that in their studies as well [20], [21], [22]. Other publications, like the one of the NICHD, verify that sleeping on the tummy and environmental stressors are the biggest risk factors for SIDS [23].
Bumper pads may increase the risk of SIDS due to the risk of suffocation. They are not recommended for children under one year of age as this risk of suffocation greatly outweighs the risk of head bumping or limbs getting stuck in the bars of the crib [24].
In the last decades either the birthrate or the age of having a baby in industrialized countries increased. A study from Central Intelligence Agency (CIA) World Factbook, United Nations Children´s Fund (UNICEF), China Sixth Nationwide Census being summarized and evaluated in a huge chart at chart mix [25] state. The trend is to be older than 30 years old when people first become parents. Due to that, we can assume that due to the older age the ability to buy such a product is bigger than it would be when people are having babies at a younger age.
According to the German Institute of Statistics, the number of smartphone users in Europe increased the last years so that a need for smartphone-integration in the smart companion pillow can be assumed [26].
Secondly, the study of existing solutions on the market is framed. At the end of the chapter, a sum up of the main conclusions derived from the State of the Art analysis is included.
2.2 Existing Solutions
2.2.1 Smart Pillows
There are different devices on the market, all capable of monitoring different features associated with sleep. In the beginning, a look at the already existing smart pillows is given. Table 4 presents the already existing smart pillows selected and analysed by the team.
Most of these pillows are also equipped with a built-in alarm thought to wake up the user when a specific stage of sleep is reached, the Rapid Eye Movement (REM), also known as light sleep. The Centa Star Relax Smart Pillow [27], iX21 [28] and Sunrise Smart Pillow [29] all contain one of these so-called smart alarms.
The more advanced pillows, like the iSense Sleep Smart Pillow [30] also contain sensors that can monitor pulse and respiratory rate.
These pillows can often be considered as gadgets because they include built-in speakers for streaming music or playing audio books. The ZeeQ Smart Pillow [31] and Sunrise Smart Pillow [32] are both good examples of this.
| Name | Features | Price [€] | Picture |
|---|---|---|---|
| ZeeQ smart pillow [33] | * wireless music streaming * sleep tracking and analysis * snore detection and prevention * partner-friendly alarm clock * smart-home integration - Alexa, If This Then That (IFTTT) * 2-week battery life | 132.00 |  |
| Sunrise Smart Pillow [34] | * sleep tracker * smart alarm/sunrise alarm * wireless music and audio books * blue light technology * cooling technology * premium memory foam | 175.00 |  |
| iX21 [35] | * intelligent alarm clock * tracks and monitors the sleep cycles, movements and ambient noises * app * analyses the sleep * personalized coaching: advice on how to improve the quality of the sleep | 149.00 |  |
| iSense Sleep Smart Pillow [36] | * heart rate * respiratory rate * sleep cycles * time it takes to fall asleep * restlessness * total sleep score | 150.00 |  |
| Centa-Star Relax Smartpillow [37] | * digital sleep monitor and coach * analyses the sleep * built-in alarm to wake you gently | 199.00 |  |
2.2.2 Sleep Trackers
Sleep trackers are devices that are focused on giving detailed information about sleeping patterns. Smart pillows are often pillows equipped with a sleep tracker. These devices come in different forms. Some of them are wearable accessories like the OURA [38] ring or the Fitbit Versa [39]. Others have to be placed in the bed, for example, the Withings Sleep [40] and the Beddit Sleep Monitor [41]. The S+ By ResMed Sleep Tracker [42] is a contactless monitor that just needs to be placed next to the bed. The Sleep Cycle Alarm Clock [43] is an app that also doesn’t require contact and can be placed outside of the bed.
All these devices measure more or less the same aspects. They focus on the different sleep stages, the duration of the sleep and the overall sleep quality. The researched products also measure the pulse of the user, only The Sleep Cycle Alarm Clock [44] doesn't have this function.
Table 5 sums up the comparison of all analysed Sleep Trackers.
| Name | Features | Price [€] | Picture |
|---|---|---|---|
| Beddit Sleep Monitor [45] | * sleep time * bedtime * time to fall asleep * time awake * time away from bed * wake-up time * sleep efficiency | 134.00 |  |
| Sleep Cycle Alarm Clock [46] | * tracks the sleep patterns using sound or vibration analyses * detects light sleep to wake up | 22.00 |  |
| Withings Sleep [47] | * sleep cycles analysis (deep, light and REM) * heart rate tracking * snore detection * IFTTT integration: -dimming lights -turning up your thermostat | 88.00 |  |
| S+ By ResMed Sleep Tracker [48] | * non-contact sleep monitor * monitors breathing, heart rate, movement and overall sleep quality * monitors environment: noise, light and temperature levels + feedback & tips * sleep score | 48.00 |  |
| Fitbit Versa [49] | * gyroscope and optical heart rate sensor * duration of your sleep * different sleep stages from light and REM to deep | 175.00 |  |
| OURA ring [50] | * very small * sleep score * statistics concerning: - quality of your rest; - resting heart rate; - how much you moved. | 314.00 |  |
2.2.3 Environment Monitors
Environment Monitors are devices that measure indoor conditions like, for instance, temperature, relative humidity (RH) and some gases. There are a lot of environment monitors available on the market. The team took a look at four types of monitors that measure different things. The only thing all of them have in common is that they are contactless.
The Sense Sleep System [51] and Withings Aura Smart Sleep System [52] can also be considered as sleep trackers since they also keep track of the sleeping pattern. In addition, they also monitor the conditions in the room and give advice on how to improve them.
The Nest Protect Smoke and Carbon Monoxide (CO) Alarm [53] is, as the name clarifies, a CO and smoke detector that warns when the CO levels in the room are too high.
Last, The First Alert Onelink GLOCO Wi-Fi Environment Monitor [54] is meant for monitoring temperature, RH, and CO levels of the infant´s room. It consists of a home station which indicates when something is wrong and also an app with additional information.
Table 6 points out the main features and prices of the four products.
| Name | Features | Price [€] | Picture |
|---|---|---|---|
| Sense Sleep System - Cotton [55] | * analysis of sleep patterns * sleep score: based on the conditions of the room and the sleep * smart alarm: wakes up the user in the lightest part of your sleep cycle * sleep insights: personalised suggestions to improve the sleep quality | 113.00 |  |
| The First Alert Onelink GLOCO Wi-Fi Environment Monitor [56] | * monitoring temperature, relative humidity, and carbon monoxide levels * color-changing glow ring indicates a problem * monitor sends information to the smartphone or tablet | 61.00 |  |
| Withings Aura Smart Sleep System [57] | * wake up & go to sleep programs * music (Spotify and radio) * heart rate * light sleep * deep sleep * REM * room temperature * luminosity (light levels) | 107.00 |  |
| Nest Protect smoke and CO alarm [58] | * detects fast and slow burning fires * detects CO * alerts on the phone * lets hush a false alarm with the phone | 129.00 |  |
2.2.4 Baby Monitors
Another different type of products are monitors specially developed for babies. These sort of monitors focus on the baby well-being, certifying the baby is doing fine (Table 7).
Some only monitor the environment. The Lollipop Smart Baby Camera and Sensor [59], VM344 Pan & Tilt Baby Monitor [60] both have cameras that give live images of the infant. Furthermore, the Lollipop Smart Baby Camera and Sensor [61] also has special features such as cry and cross detection. The Sproutling Wearable Baby Monitor [62] measures the environment but also alerts when the baby rolls over while sleeping.
On the other hand, the baby monitors that monitor things like temperature, movement and respiration are also available. The MonBaby Smart Breathing Monitor [63], Mimobaby Monitor [64] and Owlet Baby Monitor [65] are good examples of these sort of devices.
The Nanit Plus Camera [66] contains both. It is a camera that not only displays live images of the infants but also monitors the room environment (temperature and relative humidity).
Table 7 includes the compared devices with a picture, the features and the prices.
| Name | Features | Price [€] | Picture |
|---|---|---|---|
| Owlet Baby Monitor [67] | * tracks the child’s heart rate * tracks oxygen levels * notifies the parents if those levels fall outside the preset zones | 313.00 |  |
| VM344 Pan & Tilt Baby Monitor [68] | * pan, Tilt And Zoom The Camera From The Parent Unit * automatic Infrared Night Vision * multiple Viewing Options * temperature Sensor | 211.00 |  |
| Lollipop Smart Baby Camera and Sensor [69] | * live View: live feed on the tablet or smartphone * cry Detection * cross Detection: Set a border inside the camera view to track movements in the baby’s crib * data History * Event List: The Lollipop saves a 30-second video of significant events | 178.00 |  |
| Nanit Plus Camera [70] | * 24/7 High Definition (HD) live streaming * background audio lets the parents hear baby, even when the parents' phone's screen is off * soft glow nightlight * smart sensors: temperature and humidity sensors | 263.00 |  |
| Mimobaby Monitor [71] | * temperature data * movement data * respiration data | 175.00 |  |
| MonBaby Smart Breathing Monitor [72] | * sleep position alarm * proximity alarm * real-time stats and sleep cycles * breathing movement alarm * fall detection | 70.00 |  |
| Sproutling Wearable Baby Monitor [73] | * identify the optimal sleeping conditions; room temperature, relative humidity, sound and light * predict when the baby is most likely to wake up * alert sent to your phone if the infant rolls over while sleeping | 220.00 |  |
2.2.5 Overview
Figure 3 sums up the already existing features of products related to the field of baby monitors on the market.

2.3 Conclusion
The results of the developed research show that there are already devices to monitor the health of elderly people but not, simultaneously, with the measurement of indoor air quality, RH and room temperature.
Furthermore, the market of pillows already offers gadgets to reduce the risk of babies rolling from back to the tummy, one of the potential risks of SIDS. There are also devices to monitor the health of babies and the risk of rolling from back to tummy – additionally, some devices measure room temperature and RH. Other ones interact with the baby through sounds. A summary of three products from each category is shown in Figure 4.

In addition, it is recommended in scientific studies that infants sleep in the parents’ room. Sleeping close to the parents’ bed, but on a separate surface, is ideally for the first year of life [74]. Consequently, a monitoring device for indoor air quality will also benefit the parents.
Furthermore, the age of first-time parents is getting higher which means the financial income should be high enough to buy a pillow for their baby. Moreover, they are very interested to keep on using their smartphones.
According to this research, the market lacks devices that, simultaneously, reduce the risk of rolling from back to tummy (shape of the pillow), allow interaction (microphone and speaker integrated in the pillow), monitor the health of the baby (pulse sensor sock), measure the room air quality (temperature, RH and CO2 sensors incorporated in a base station) and provide access to all this information through a mobile application.
Taking into account these findings, the team embraced the concept of a 4 in 1 product for babies: (i) pillow with a special shape; (ii) microphone and speaker integrated in the pillow; (iii) pulse sensor in a sock; and (iv) room sensors in a home station. To contribute to relief the stress of parents, the team chose to create a mobile application to display the collected data and allow remote interaction.
For this project, the company name will be SleepSense and the product name bGuard.
As a project is a temporary effort in order to create a product, it is absolutely necessary to define its beginning and end, as also the scope and resources involved. Therefore, the next chapter is related to Project Management.
3. Project Management
3.1 Introduction
After pointing out the main goals of the project in the State of the Art chapter it is important to have an overview over the time, the costs and the risks. Thus the following chapter a Project Management strategy is made.
3.2 Scope
The Scope gives an overview of the main actions of the project. Consequently, the scope is developed. It supports to determine tasks and distribute all resources. Furthermore, it prevents the main goal of the project is not realized. Figure 5 shows the Work Breakdown Structure (WBS). Step by step, the WBS offers all the main subjects which are part of the project.

3.3 Time
3.3.1 Gantt Chart
Based on the scope a Gantt Chart is made. Actually, the team is planning for each Sprint and divide the tasks for each team member. This is an agile way of planning the project. But there are several deadlines the team has to care about. Therefore, the Gantt Chart has the benefit of giving an overview of the project. Moreover, it supports time management. Figure 6 shows the construction of the Gantt Chart. It is divided into six phases: Project Definition, Project Concept, Project Plan, Prototyping, Testing, Final Reporting. Each phase has one or more deadlines.

3.3.2 Deliverables & Deadlines
In Table 8 the deliverables from the Gantt Chart with the deadlines are summarized.
| Deliverables | Deadlines |
|---|---|
| Define the Project Backlog | 2019-03-06 |
| Black Box (System Diagrams & Structural Drawings) | 2019-03-11 |
| Detailed Schematics, Structural Drawings and Cardboard Model | 2019-03-22 |
| List of Materials (What & Quantity) | 2019-03-27 |
| Upload Interim Report and Presentation | 2019-04-06 |
| Interim Presentation | 2019-04-11 |
| Complete the List of Materials | 2019-04-23 |
| Upload refined Interim Report | 2019-05-30 |
| Upload results of the Functional Tests | 2019-06-03 |
| Upload the Final Report, Presentation, Video, Paper, Poster and Manual | 2019-06-14 |
| Final Presentation, Individual Discussion and Assessment | 2019-06-19 |
| Update the wiki with all correction suggestions | 2019-06-25 |
| Hand in the prototype and user manual | 2019-06-27 |
3.4 Cost Calculation
3.4.1 Material Resources
The material resources are based on the price for each component or material and the respective quantity. Table 9 shows the list of materials and components for the prototype.
| Nr | Item | Part of bGuard | Provider | Quantity | Unit | Unit Price [€] | Item Cost [€] |
|---|---|---|---|---|---|---|---|
| 1 | PLA | Home Station (bottom) | LSA | 0.05850 | kg | 21.96 | 1.28 |
| 2 | PLA | Home Station (top) | LSA | 0.02848 | kg | 21.96 | 0.62 |
| 3 | PLA | Sensor case (bottom) | LSA | 0.00262 | kg | 21.96 | 0.06 |
| 4 | PLA | Sensor case (top) | LSA | 0.00262 | kg | 21.96 | 0.03 |
| 5 | TPU | Wire cover sensor case | LSA | 0.00156 | kg | 30.96 | 0.05 |
| 6 | Printing | Home Station, sensor case | LSA | 1 | un | 26.45 | 26.45 |
| 7 | Tencel | Pillow, Sock | Flexitex | 0.75 | m2 | 2.49 | 1.87 |
| 8 | PU Foam 3035 | Pillow | A Central da Borracha | 0.033 | m3 | 237.75 | 7.85 |
| 9 | PU Foam 3049 | Pillow | A Central da Borracha | 0.00078 | m3 | 275.73 | 0.22 |
| 10 | XPS | Pillow | Fibran | 0.00005 | m3 | 182.00 | 0.01 |
| 11 | Cool Thermic | Pillow | LMA | 0.014 | m2 | 20.50 | 0.29 |
| 12 | Zippers and velcro | Pillow, Sock | Molarte | 1 | un | 8.00 | 8.00 |
| 13 | Espressif ESP32 DevKitC | Home Station, Pillow | pt.mouser | 2 | un | 8.73 | 17.76 |
| 14 | Micro SD card 8GB | Pillow | pt.mouser | 1 | un | 6.50 | 6.50 |
| 15 | Transportation costs for items 13 and 14 | Home Station, Pillow | pt.mouser | 1 | un | 20.00 | 20.00 |
| 16 | Heart rate sensor module | Sock | DFI, ISEP | 1 | un | 22.09 | 22.09 |
| 17 | DHT22 Temperature & Humidity Sensor | Home Station | DFI, ISEP | 1 | un | 11.60 | 11.60 |
| 18 | BreadBoard | Home Station, Pillow | DFI, ISEP | 2 | un | 6.00 | 12.00 |
| 19 | Jumper Wires - Female/Female | Home Station, Pillow | DFI, ISEP | 20 | un | 0.07 | 1.40 |
| 20 | Jumper Wires - Male/Female | Home Station, Pillow | DFI, ISEP | 20 | un | 0.11 | 2.20 |
| 21 | PCB - board | Home Station, Pillow | DFI, ISEP | 2 | 1.35 | un | 2.70 |
| 22 | 1kΩ Resistor | Home Station | DFI, ISEP | 1 | un | 0.11 | 0.11 |
| 23 | SGP30 -eCO2 and VOC | Home Station | botnroll | 1 | un | 22.95 | 22.95 |
| 24 | MAX4466 - Microphone sensor | Pillow | pt.mouser | 1 | un | 6.07 | 6.07 |
| 25 | DFPlayer - MP3 mini player | Pillow | electrofun | 1 | un | 5.45 | 5.45 |
| 26 | Mini Speaker | Pillow | botnroll | 1 | un | 1.00 | 1.00 |
| 27 | 5V Battery | Pillow | electrofun | 1 | un | 5.50 | 5.50 |
| 28 | 5V, 2A Power Supply | Home Station | electrofun | 1 | un | 6.80 | 6.80 |
| TOTAL | 211.54 |
Cost management is necessary for every project. It has an influence on the decision. Therefore the working costs and the material cost are analyzed in this subsection.
3.4.2 Labour Costs
Normally the costs for the work resources are one of the largest proportions in developing a product. In the EPS it is different because students are working for no salary on the project. Nevertheless, it is interesting to see how the cost for the development of the smart pillow would be if the team members are working as engineers in a company. The calculation of the costs is based on the salary of a beginner engineer in Portugal because the team members are living here [75]. The total labour cost (Table 10) in one year is 85 800 € for a whole team of young engineers.
| Name | Cost per month [€] | Months of labor | Total [€] |
|---|---|---|---|
| Elien | 1 300 | 11 | 14 300 |
| Alex | 1 300 | 11 | 14 300 |
| Ko | 1 300 | 11 | 14 300 |
| Tobi | 1 300 | 11 | 14 300 |
| Vaido | 1 300 | 11 | 14 300 |
| Marcel | 1 300 | 11 | 14 300 |
| Total labour cost in one year | 85 800 |
3.4.3 Break-Even Point Estimations
Based on the labour costs in one year plus the advertisement (11 000 €), there is a total of 96 800 € that is spent on developing the product. The estimated selling quantity is 5 000 units a year, this is based on the fact this is a niche product in a relatively new market. However, it is also an expensive product indicating that not everyone can afford it.
The mathematics are done with the costs of the prototype in Table 9. In total, it costs 211.54 € to develop the prototype. The company will sell the product for a price of 249.00 €, so the profit on each product is 37.44 €.
To calculate the break-even point the formula ‘’Fixed Costs ÷ (Price – Costs per unit) = Breakeven Point in Units’’ is used. The fixed costs, in this case, are the labour costs plus expenses for advertisement. When in fact the price and the costs per unit are fixed. So, the calculation gives 96 800 ÷ (249.00-211.54) = 2 585 units. Because the estimated selling quantity is 5 000 units a year, the company is starting to make profit within about six months. Figure 7 shows how the break-even point works for a company.

The break-even point was calculated with the price of the prototype. The final product will have a lower price due to transportation costs that will be lower per part, as also to negotiations with suppliers based on quantities. Nevertheless, other costs would be considered in a real company like insurances, social security, taxes and so on. In conclusion, the team is aware of these facts and decided that the prototype cost would be a good approximation to determine the break-even point.
3.5 Quality
The Smart Pillow is a product with many features. To keep the trust of the customers it is necessary to have high quality. Therefore it is important to know what the team has to check during the tests.
Product quality
The designing and testing phrases are very important to get a high quality of the product. In the designing phase, it is important to don’t make the product too complicated and use the knowledge of experts. During the testing phase, it is important to calibrate the sensors and evaluate the values in a scientific way. The tests will be furthermore explained in Tests and Results. After the designing and testing phase, it is important to know if the supplier is reliable, so all the components will be tested by the delivery.
Material quality
The quality of the materials is also important. After the delivery, the team members make a visual check if the parts are damaged. Furthermore, the materials have to conform to all the EU Directives of health and low voltage.
Service quality
bGuard has an integrated application for smartphones with several features like a warning system and the monitoring of the baby and room status. Therefore it is important that the application has no false warnings. Furthermore, the monitoring has to be right too.
Specification of the quality requirements
To verify good product quality, requirements management including the requirement analysis documentation is very important. In the requirements specification document, the customer requirements towards to product are stated. In the technical specification document, the service provider presents in a concrete form how he would and could implement the project for the client. While the Scope Statement sets how to do it the Product Requirements document states in an easily understandable way what the customer wants - it can be seen in Problem Statement.
In the Technical Specification Document or the Functional Specifications, the customer requirements are transferred into technical solutions. The objectives should include measurable success criteria for the project. It can be seen in Functional Specification.
3.6 People
A Responsibility Matrix (Table 11) is used to define who in the team is responsible for individual work elements and deliverables. By forming a matrix with the WBS, responsibilities can be assigned to lower level tasks. In the table there are some initials used, meanings are: P= Participant; A= Accountable; R= Responsible; I= Inform; S= Sign; C= Consultant.
| Task/People | Alex | Elien | Ko | Marcel | Tobias | Vaido | Supervisors |
|---|---|---|---|---|---|---|---|
| Scrum Planning (Scrum Master) | R | P | P | P | P | P | A,C |
| Acquire sponsors | R | P | P | P | P | P | A,C |
| Gantt chart | P | P | P | R | P | P | A,C |
| Blackbox diagram | P | P | R | P | P | P | A,C |
| Technical research | I | R | P | A,C | |||
| Market research, existing products | P | R | P | I | I | I | A,C |
| Initial budget planning | R | P | P | A,C | |||
| Specific plan | P | P | R | P | P | P | A,C |
| Business and Marketing plan | I | P | I | I | R | I | A,C |
| Sustainability | R | P | P | I | I | A,C | |
| Ethics | P | R | P | I | I | A,C | |
| CAD model and 3D print | I | I | R | I | R | A,C | |
| Product requirements and verification | P | I | P | R | R | P | A,C |
| Software requirements and verification | I | I | I | R | R | P | A,C |
| Final schemes, diagrams | I | R | R | P | P | R | A,C |
| List of materials | P | P | P | R | I | P | A,C |
| Interim presentation | P | R | P | P | P | P | A,C |
| Interim report | R | P | P | P | P | P | A,C |
| Regulatory Affairs | I | I | I | P | R | I | A,C |
| Prototype implementation hardware | P | P | P | P | P | R | A,C |
| Prototype implementation software | I | I | I | P | R | P | A,C |
| IoT platform | I | I | I | R | P | I | A,C |
| Prototype design and assembly | P | R | R | P | P | P | A,C |
| Prototype functional tests and Quality assurance | I | I | P | R | R | I | A,C |
| Final report | R | P | P | R | P | P | A,C |
| Video | R | A,C | |||||
| Poster | R | A,C | |||||
| Manual | R | A,C | |||||
| Leaflet | R | A,C |
3.7 Communication
An important part of a project is communication. Inefficient communication can result in tension in the team. To prevent inefficient communication a communication matrix is made (Table 12). This communication matrix shows how communication is organized in the team. When the team is not together Google Drive and a WhatsApp group is used. Besides that, the team has several meetings by doing Scrum planning. Furthermore, the team has a weekly meeting with the supervisors.
| What | Who | Why | When | How |
|---|---|---|---|---|
| Deliverables | Responsible person | Development of the project | On the deadline | Uploading to Wiki |
| Meetings with supervisors | The team | To update the supervisors about the progress of the project | Weekly on Thursday | Face-to-face with a presentation |
| Agenda | The team | To inform the supervisors about the subject to discuss | 24 hours before the weekly meeting with the supervisors | Uploading to Wiki |
| Interim presentation | The team | To get feedback from the supervisors and other students on our project | 2019-04-11 | Oral presentation |
| Daily Scrum | The team | Short communication what each team member had done the last day and what he is planning to do the next 24 hours | Daily | Face-to-face |
| Sprint planning | The team | Add tasks to the Project Backlog, divide the tasks to the team members, assess the time for each task | Weekly | Face-to-face |
| Sprint Review | The team | The team discusses which tasks were done and which tasks need to be continued in the next Sprint | Weekly | Face-to-face |
| Sprint Retrospective | The team | The team discusses what went well and what could be improved in the next sprints | Weekly | Face-to-face |
3.8 Risk
During the project, problems can appear. Every problem can have an impact on the progress of the project. Therefore, it is important to have an overview of possible risks. If risks appear, the team has to handle with them.
Table 14 shows the risk analysis of the project. In the first step, the risk is identified. After that, the risks are categorized into three risk categories: Organizational, Project Management and Technical. The second step is the Risk Exposure. Therefore, each risk is valued. The main target is to get a Score between the probability and the impact. Table 13 shows the Impact-Probability Matrix which is used to determine the score. For this purpose, the impact rating and the risk probability is multiplied [76].

In the final step is the Risk Response. It is divided into the following types:
- Avoid - Eliminate the cause of the risk;
- Mitigate - Reduce the impact of a risk;
- Exploit - Add work to make sure the opportunity occurs.
The Strategy gives an explanation of the Risk response. It shows possible solutions to manage the problem.
| Risk Identification | Probability | Impact | Score | Response | Strategy |
|---|---|---|---|---|---|
| Organizational | |||||
| Insurance of a team member | 1 | B | 50 | Mitigate | The risk can not be eliminated, the team tries to split the work of the team member |
| The wiki does not work for a period | 2 | B | 40 | Mitigate | The team keeps on the work in OneDrive until it is fixed |
| Files are not available anymore/ Have to be done a second time | 4 | B | 15 | Mitigate | Make a private secure of the files |
| Suppliers do not deliver components in the planned time | 2 | A | 80 | Avoid | Only choose suppliers who are able to deliver in the right time |
| Conflict with stakeholders over proposed changes | 4 | C | 3 | Avoid | Proof the changes with scientific research |
| Project Management | |||||
| Requirements are incomplete | 4 | A | 60 | Exploit | The team makes more research to solve the problem |
| Wrong time management- the team misses' deadlines | 2 | A | 80 | Exploit | Try to do another task faster |
| Project team misunderstand requirements | 3 | A | 60 | Avoid | Ask a lot of questions in the meetings with the supervisors |
| Under communication | 4 | B | 15 | Avoid | Talk to each other if something is not clear |
| The documentation is not complete | 4 | B | 80 | Avoid | Try to do another task faster |
| Wrong time management- the team misses' deadlines | 2 | A | 80 | Exploit | Before uploading the final report, the team checks every chapter of completeness |
| Technical | |||||
| Programmed code does not work | 2 | A | 80 | Mitigate | Ask one of the teachers for help/ Search on the Internet |
| The hardware does not work | 4 | A | 30 | Mitigate | Contact the supplier for replacement |
| Parts are wrong designed/ produced in a wrong way | 4 | B | 15 | Avoid | Four-eyes principle - Two team members check the drafts |
| The quality of the materials is bad | 4 | B | 15 | Exploit | Make the prototype of it, but search for other suppliers and materials of the next steps |
| Not enough Know-How | 3 | C | 6 | Mitigate | Ask the teacher for help/ Research on the internet |
| The product does not follow EU requirements | 4 | A | 30 | Avoid | Research of all EU- requirements |
Summary of the Risk Analysis
After the risk analysis, the team knows about the impact of several tasks and how to handle them with care. Many risks can be avoided with detailed research. Moreover, the communication in the team and with the stakeholders is important. The risks with the highest score in Table 14 have all an impact on time management. In consequence, the team has to take care of that challenge over the whole time of the project. Nevertheless, a risk can appear. In this situation, the team has to manage the problem with the Response Strategy.
3.9 Procurement
Time management highly impacts on the team's success. One important process to manage time is Procurement. Everything required from outside of the team has to be in place when it is needed. So the team has to analyze what items will be purchased from the outside. It is important to make sure that the Team received products at the best possible price but also high quality compared with other external suppliers. Table 15 shows the summary of the procurement alternatives ordered by the type of material.
In order to sell a sustainable product, the team has to take care of cost, quality and time. To save those objectives it is important that the team has to evaluate the delivery of components and materials. Hence, the team compares suppliers only from Portugal. They keep the delivery costs low and the time to deliver short. Another requirement is the availability of the products. All of them has to be in stock to keep the factor of time. Furthermore, alternatives are listed for the sponsored components and materials.
| Nr | Item | Parts | Provider | Alternative Provider |
|---|---|---|---|---|
| Hardware components | ||||
| 1 | Espressif ESP32 DevKitC | Home Station, Pillow | pt.mouser | botnroll, electrofun |
| 2 | Micro SD card 8GB | Pillow | pt.mouser | botnroll, electrofun |
| 3 | Heart rate sensor module | Sock | DFI, ISEP | pt.mouser |
| 4 | DHT22 Temperature & Humidity Sensor | Home Station | DFI, ISEP | pt.mouser, botnroll, electrofun |
| 5 | BreadBoard | Home Station, Pillow | DFI, ISEP | electrofun |
| 6 | Jumper Wires - Female/Female] | Home Station, Pillow | DFI, ISEP | electrofun, pt.mouser |
| 7 | Jumper Wires - Male/Female | Home Station, Pillow | DFI, ISEP | electrofun, pt.mouser |
| 8 | PCB - board | Home Station, Pillow | DFI, ISEP | electrofun |
| 9 | 1kΩ Resistor | Home Station | DFI, ISEP | pt.mouser, electrofun |
| 10 | SGP30 -eCO2 and VOC | Home Station | botnroll | pt.mouser |
| 11 | MAX4466 - Microphone sensor | Pillow | pt.mouser | pt.banggood |
| 12 | DFPlayer - MP3 mini player | Pillow | electrofun | pt.robotics |
| 13 | Mini Speaker | Pillow | botnroll | pt.mouser, electrofun |
| 14 | 5V Battery | Pillow | electrofun | botnroll |
| 15 | 5V, 2A Power Supply | Home Station | electrofun | botnroll |
| Textile, Foam, Zipper and Velcro Material | ||||
| 16 | Tencel | Pillow, Sock | Flexitex | Riopele |
| 17 | PU Foam 3035 | Pillow | A Central da Borracha | Flex2000 |
| 18 | PU Foam 3049 | Pillow | A Central da Borracha | Flex2000 |
| 19 | XPS | Pillow | Fibran | Eurofoam |
| 20 | Cool Thermic | Pillow | LMA | A. Sampaio & Filhos Textêis |
| 21 | Zippers and Velcro | Pillow, Sock | Molarte | Mindol |
| Casing Material | ||||
| 22 | PLA | Home station (bottom) | LSA, ISEP | kuantokusta.pt, reprap.pt, pt.farnell |
| 23 | PLA | Home station (top) | LSA, ISEP | kuantokusta.pt, reprap.pt, pt.farnell |
| 24 | PLA | Sensor case (bottom) | LSA, ISEP | kuantokusta.pt, reprap.pt, pt.farnell |
| 25 | PLA | Sensor case (top) | LSA, ISEP | kuantokusta.pt, reprap.pt, pt.farnell |
| 26 | TPU | Wire cover sensor case | LSA, ISEP | kuantokusta.pt, reprap.pt, pt.farnell |
3.10 Stakeholders Management
Stakeholders are persons, groups or organizations that have interests or concerns in an organization. Moreover, a stakeholder can affect or be affected by the organization's actions, objectives and policies [78]. Table 16 shows the power and influence of the stakeholders which have an impact on the project.
First of all the team is listed. With all decisions during the whole process, it has the most affect the success of the project. Other stakeholders are sponsors and supporters. Sponsors and supporters give the team the components, materials, tools, labour and counselling for working in the project. On the third place, there are the supervisors. With the weekly meetings, they can give the team feedback and advice. The suppliers only provide the materials but have no how influence on the project. After that, the competitors are listed. They, with prices and features, have an influence on the segmentation of the product. Finally, there are the consumers. They have low power and a medium influence. The team takes care to sell benefits that the consumers need and offer the price for the product they are willed to buy.
| Who | Role | Power | Influence |
|---|---|---|---|
| Team | Developers | High | High |
| Supervisors | Controllers | High | Medium |
| Sponsors and Supporters | Providing components, materials, tools, labour and counselling | High | Low |
| Competitors | Competition | Low | Medium |
| Consumers | Buying products | Low | Medium |
| Suppliers | Providing materials | Low | Low |
Figure 8 shows the stakeholders' matrix. The matrix gives an overview of the power and the impact of all stakeholders.

3.11 Sprint Outcomes
Table 17 to Table 29 show the summary of the Sprint Reviews the team has done during the project. It includes the number of the Product Backlog Item (PBI). In the same column are Procedures (P). They are tasks which have to be done every week. After that, there is the description of the Tasks which are ordered to the Sprint out of the Project Backlog. Moreover, there is the assignee, the planned effort, the needed time and the status. The team started with Sprint Planning after the third week of the project. For the organization, the Microsoft Planner is used.
| PBI/P | Task | Assignee | Planed effort [days] | Needed time [days] | Status | Reasons why tasks were not completed |
|---|---|---|---|---|---|---|
| 1 | Design product logo | Elien | 1 | 1 | Completed | / |
| P | After meeting with supervisors of 2019-03-14 | Alex | 0.1 | 0.1 | Completed | / |
| 4 | Prepare the presentation of the logo | Elien | 0.2 | 0.2 | Completed | / |
| 13 | Design company logo | Ko | 1 | 1 | Completed | / |
| 11 | Prepare the presentation for the ethical scandal | Ko, Tobi | 1 | 1.5 | Completed | / |
| 2 | Prepare the leaflet | Elien | 1 | 2 | Completed | / |
| 3 | Sustainability - Introduction | Alex | 1 | 1 | Completed | / |
| 6 | Research of environmental sensors | Vaido | / | / | Not Completed | Doubts on the accuracy of the sensors |
| 7 | Research of baby sensors (wireless, analog) | Tobi | / | / | Not Completed | Doubts on the type of sensors to research |
| 9 | Research of Microcontrollers/ Bluetooth module/ Microcomputers | Marcel | / | / | Not Completed | Doubts on the way communications will be done |
| 8 | Research of Microphone/Speakers | Marcel | / | / | Not Completed | Doubts on the type of microphone needed for the project |
| 10 | System Schematics | Vaido | / | / | Not Completed | Waiting for which components will be needed |
| P | Prepare the meeting with supervisors of 2019-03-21 | Elien | 0.1 | 0.1 | Completed | / |
| 20 | Design of the pillow and the baby sensor | Elien, Ko | / | / | Not Completed | Difficulties on the decision of the dimensions |
| 43 | Ethic Scandal Presentation | Elien | 1 | 1 | Completed | / |
| 44 | Design product logo | Tobi, Ko | 0.1 | 0.1 | Completed | / |
| 29 | Solidworks – Structural Drawings (Home Station) | Ko | 0.5 | 1 | Completed | / |
| Sprint Velocity | 7.0 | 9.0 |
| PBI/P | Task | Assignee | Planed effort [days] | Needed time [days] | Status | Reasons why tasks were not completed |
|---|---|---|---|---|---|---|
| P | Prepare the meeting with supervisors of 2019-03-28 | Ko | 1 | 1 | Completed | / |
| 6 | Research of environmental sensors | Vaido | 1 | 1 | Completed | / |
| 7 | Research of baby sensors (wireless, analog) | Tobi | 0.5 | 0.5 | Completed | / |
| 9 | Research of Microcontrollers/ Bluetooth module/ Microcomputers | Marcel | 0.5 | 1 | Completed | / |
| 8 | Research of Microphone/Speakers | Marcel | 0.5 | 0.5 | Completed | / |
| 55 | Write conclusion of the choice of sensors and micro-controllers | Marcel | 0.1 | 0.5 | Not Completed | The research was finish but now its is necessary to compare the available options and decide |
| 56 | Adding the comparison of all sensors and micro-controllers as tables into the wiki | Marcel | 1 | 1 | Not Completed | Still on going the task of preparing the information for the tables |
| P | Sustainability - Introduction | Alex | 0.5 | 0.5 | Completed | / |
| P | Week Report (wiki Logbook) on 2019-03-25 | Marcel | 0.1 | 0.1 | Completed | / |
| 45 | Project Management - Scope | Elien | 1 | 1 | Completed | / |
| 30 | List of Sensors – to hand in, requirements and sensor range | Vaido | 0.5 | 0.5 | Completed | / |
| 5 | Build the cardboard model | Elien, Ko | 1.5 | 1.5 | Completed | / |
| P | After meeting with supervisors of 2019-03-21 | Marcel, Vaido | 0.1 | 0.1 | Completed | / |
| P | Sprint 1 analysis | Alex | 0.1 | 0.1 | Completed | / |
| 18 | Research to confirm ranges of RH, temperature, CO2 in baby's room | Alex | 0.1 | 0.1 | Completed | / |
| P | 5th Week Report | Marcel | 0.1 | 0.1 | Completed | / |
| 14 | Sustainability – UNESCO Sustainable Development Goals | Alex | / | / | Not Completed | Still to decide what goals the project matchs with |
| 25 | Ethical and Deontological Concerns - Introduction | Elien | 0.1 | 0.1 | Completed | / |
| 24 | Marketing Plan – Strategy Positioning | Elien | 1 | 1 | Completed | / |
| Sprint Velocity | 9.7 | 10.6 |
| PBI/P | Task | Assignee | Planed effort [days] | Needed time [days] | Status | Reasons why tasks were not completed |
|---|---|---|---|---|---|---|
| 41 | Project Management - Costs | Marcel | 2 | 2.5 | Completed | / |
| P | Week Report (wiki Logbook) on 2019-04-01 | Alex | 0.1 | 0.1 | Completed | / |
| 16 | Sustainability - Life Cycle Analysis | Alex, Ko | / | / | Not Completed | Decisions to still be taken concerning some parts of the product |
| 28 | Marketing Plan - Market analysis | Tobias | 2 | 3 | Completed | / |
| 27 | Marketing Plan - SWOT Analysis | Tobias | / | / | Not Completed | Difficulties on some decisions to be included or not |
| 12 | Presentation for the Communication class | Elien | 1 | 1 | Completed | / |
| 10 | System Schematics | Vaido | 2 | 2 | Completed | / |
| P | Week Report (wiki Logbook) on 2019-04-01 | Alex | 0.1 | 0.1 | Completed | / |
| 52 | Table for the voltage of power supply and decide | Vaido | / | / | Not Completed | Decision is taken but still need to make the table |
| 36 | Project Management - Stakeholders management | Marcel | 1 | 1 | Completed | / |
| Sprint Velocity | 8.1 | 9.7 |
| PBI/P | Task | Assignee | Planed effort [days] | Needed time [days] | Status | Reasons why tasks were not completed |
|---|---|---|---|---|---|---|
| 35 | Project Management - Procurement | Marcel | / | / | Not Completed | Parts and suppliers still to be decided |
| 22 | Marketing Plan - Strategic Objectives | Elien | / | / | Not Completed | Some strategies still to be decided |
| 50 | Ethics - Conclusion | Elien | 0.2 | 0.2 | Completed | / |
| 49 | Ethics - Liability | Elien | 0.3 | 0.5 | Completed | / |
| 48 | Ethics - Environmental Ethics | Elien | 0.3 | 0.5 | Completed | / |
| 47 | Sales and Marketing Ethics | Elien | 0.3 | 0.3 | Completed | / |
| 17 | Sustainability - Conclusion | Alex | 0.2 | 0.2 | Completed | / |
| 19 | Sustainabilty - Environment | Alex , Ko | 0.3 | 0.3 | Completed | / |
| 15 | Sustainability - Economic | Alex | 0.3 | 0.3 | Completed | / |
| 28 | Marketing Plan - Market analysis | Tobias | 0.3 | 1 | Completed | / |
| P | Sprint 2 analysis | Alex | 0.1 | 0.1 | Completed | / |
| P | After meeting with supervisors of 2019-03-28 | Alex | 0.1 | 0.1 | Completed | / |
| 53 | List of components - Power supply | Vaido, Marcel | 0.5 | 0.5 | Completed | / |
| 26 | Project Management - Risk | Marcel | 1 | 1 | Completed | / |
| 31 | Project Management - Time | Marcel | 0.5 | 0.5 | Completed | / |
| 55 | Write conclusion of the choice of sensors and micro-controllers | Marcel | 0.1 | 0.5 | Completed | / |
| 56 | Adding the comparison of all sensors and micro-controllers as tables into the wiki | Marcel | 1 | 1 | Completed | / |
| 14 | Sustainability – UNESCO Sustainable Development Goals | Alex | 0.2 | 0.5 | Completed | / |
| 20 | Design of the pillow and the baby sensor | Elien, Ko | 2 | 6 | Completed | / |
| Sprint Velocity | 7.7 | 13.5 |
| PBI/P | Task | Assignee | Planed effort [days] | Needed time [days] | Status | Reasons why tasks were not completed |
|---|---|---|---|---|---|---|
| 102 | Edit the report based on the feedback received for the moment | Team | / | / | Not Completed | Still chapters to improve based on the feedback |
| 74 | Concept first pictures of the application | Elien | 0.5 | 0.5 | Completed | / |
| 62 | Start working on the arduino code/ Testing Sensors | Vaido | 3 | 3 | Completed | / |
| 12 | Research of pillow materials | Elien, Ko | / | / | Not Completed | Some materials are not decided yet |
| P | Sprint analysis - Sprint 4, 04-04-2019 to 10-04-2019 | Alex | 0.6 | 0.6 | Completed | / |
| P | Week Report (wiki Logbook) 8th Week Report (2019-04-08 to 2019-04-12) | Alex | 0.1 | 0.1 | Completed | / |
| P | Prepare the meeting with supervisors - 8th Meeting (2019-04-24) | Alex | 0.1 | 0.1 | Completed | / |
| 16 | Sustainability - Life Cycle Analysis | Alex, Ko | 1.5 | 1.5 | Completed | / |
| 27 | Marketing Plan - SWOT Analysis | Tobias | 0.3 | 0.3 | Completed | / |
| 52 | Table for the voltage of power supply and decide | Vaido | 0.2 | 0.5 | Completed | / |
| Sprint Velocity | 6.3 | 6.6 |
| PBI/P | Task | Assignee | Planed effort [days] | Needed time [days] | Status | Reasons why tasks were not completed |
|---|---|---|---|---|---|---|
| 89 | Refine Ethics chapter | Elien | 0.8 | 1 | Completed | / |
| 87 | Refine State of the Art chapter | Ko | 0.5 | 0.5 | Completed | / |
| 88 | Refine Sustainability chapter | Alex | / | / | Not Completed | Waiting for decision on still missing materials |
| 90 | Refine Project Developement (the parts we have so far) | Marcel | 1 | 1 | Completed | / |
| 101 | New Black Box | Elien | 0.1 | 0.1 | Completed | / |
| P | After meeting with supervisors - 8th Meeting (2019-04-24) | Alex | 0.1 | 0.1 | Completed | / |
| P | Sprint analysis - Sprint 5, 11-04-2019, 23-04-2019 and 24-04-2019 | Alex | 0.6 | 0.6 | Completed | / |
| P | Week Report (wiki Logbook) 9th Week Report (2019-04-22 to 2019-04-26) | Alex | 0.1 | 0.1 | Completed | / |
| 85 | Refine Project Management chapter | Alex, Marcel | 1.5 | 2 | Completed | / |
| 86 | Refine Marketing chapter | Tobi | 4.5 | 4.5 | Completed | / |
| 135 | Reorganize the information in wiki to show the differences between the Prototype and the Vision of the Product | Marcel | 1 | 1 | Completed | / |
| 7 | Research of baby sensors (wireless, analog) | Tobi | 0.5 | 0.5 | Completed | / |
| 9 | Research of Microcontrollers/ Bluetooth module/ Microcomputers | Marcel | 0.5 | 1 | Completed | / |
| 22 | Marketing Plan - Strategic Objectives | Elien | 0.4 | 0.6 | Completed | / |
| 12 | Research of pillow materials | Elien, Ko | 1.5 | 4 | Completed | / |
| Sprint Velocity | 13.1 | 17.0 |
| PBI/P | Task | Assignee | Planed effort [days] | Needed time [days] | Status | Reasons why tasks were not completed |
|---|---|---|---|---|---|---|
| P | Prepare the meeting with supervisors - 9th Meeting (2019-05-02) | Alex | 0.1 | 0.1 | Completed | / |
| P | Sprint analysis - Sprint 6, 26-04-2019 to 30-04-2019 | Alex | 0.6 | 0.6 | Completed | / |
| P | After meeting with supervisors - 9th Meeting (2019-05-02) | Alex | 0.1 | 0.1 | Completed | / |
| P | Week Report (wiki Logbook) 10th Week Report (2019-04-29 to 2019-05-03) | Alex | 0.1 | 0.1 | Completed | / |
| 124 | Include the resistor in the list of components | Marcel | 0.1 | 0.1 | Completed | / |
| 96 | First step of the Final Report in Overleaf/LaTeX | Alex | 3 | 4 | Completed | / |
| 103 | Graph with the concept of the product (similar to the concept of the prototype) | Elien | 0.2 | 0.2 | Completed | / |
| 106 | Separate compartments for the sensors in the home station | Ko | 0.5 | 1 | Completed | / |
| 114 | Reposition of bGuard on a higher price level | Alex, Elien, Tobi | 0.1 | 0.1 | Completed | / |
| 115 | Redefine estimated price for bGuard | Alex, Elien, Tobi | 0.1 | 0.1 | Completed | / |
| 128 | Plant-based memory foam or normal PU foam | Alex, Elien, Ko | 0.2 | 0.2 | Completed | / |
| 130 | Decide the range of measurements to send a notification (pulse, temperature, humidity and CO2) | Alex, Elien | 0.1 | 0.1 | Completed | / |
| 129 | Decide the references to be used for the range of measurements | Alex, Elien | 0.1 | 0.1 | Completed | / |
| 132 | New designs for the app | Elien | 0.2 | 0.2 | Completed | / |
| 134 | Improve the Stakeholders Analisys | Marcel | 0.1 | 0.1 | Completed | / |
| 136 | Redefine the Positioning Matrix | Alex, Elien, Tobi | 0.2 | 0.2 | Completed | / |
| 137 | Global Review of wiki | Alex | / | / | Not Completed | Waiting for new information to be included in the chapters |
| 140 | Home Station Structural Drawing | Ko | 2 | 4 | Completed | / |
| 143 | Testing the sensors | Vaido | 3 | 4 | Completed | / |
| Sprint Velocity | 10.8 | 15.3 |
| PBI/P | Task | Assignee | Planed effort [days] | Needed time [days] | Status | Reasons why tasks were not completed |
|---|---|---|---|---|---|---|
| P | Prepare the meeting with supervisors - 10th Meeting (2019-05-16) | Alex | 0.1 | 0.1 | Completed | / |
| 75 | Choice of open-source IoT platform | Marcel | 0.4 | 1 | Completed | / |
| P | Sprint analysis - Sprint 7, 02-05-2019, 03-05-2019, 13-05-2019 to 15-04-2019 | Alex | 0.6 | 0.6 | Completed | / |
| P | After meeting with supervisors - 10th Meeting (2019-05-16) | Alex | 0.1 | 0.1 | Completed | / |
| 146 | Initial tests – CO2 sensor | Tobi | / | / | Not Completed | Bad connections in the breadboard |
| 145 | Initial tests – pulse sensor | Tobi | 1 | 3 | Completed | / |
| 147 | Initial tests – relative humidity sensor | Marcel | / | / | Not Completed | Measurements far from reality |
| 148 | Initial tests – temperature sensor | Marcel | 2 | 2 | Completed | / |
| 149 | First version of the manual | Elien | 3 | 4 | Completed | / |
| 150 | Overleaf/LaTeX workshop | Alex | 0.2 | 0.2 | Completed | / |
| P | Week Report (wiki Logbook) 11th Week Report (2019-05-13 to 2019-05-17) | Alex | 0.1 | 0.1 | Completed | / |
| 151 | Solidworks drawings for the 3D printing – home station bottom | Ko | 1.5 | 2 | Completed | / |
| 152 | Solidworks drawings for the 3D printing – home station top | Ko | 2 | 2 | Completed | / |
| Sprint Velocity | 11.0 | 15.1 |
| PBI/P | Task | Assignee | Planed effort [days] | Needed time [days] | Status | Reasons why tasks were not completed |
|---|---|---|---|---|---|---|
| 146 | Initial tests – CO2 sensor | Tobi | 2 | 3 | Completed | / |
| 147 | Initial tests – RH sensor | Marcel | 2 | 2 | Completed | / |
| P | Prepare the meeting with supervisors - 11th Meeting (2019-05-23) | Alex | 0.1 | 0.1 | Completed | / |
| P | Sprint analysis - Sprint 8, 16-05-2019 to 22-05-2019 | Alex | 0.6 | 0.6 | Completed | / |
| P | After meeting with supervisors - 11th Meeting (2019-05-23) | Alex | 0.1 | 0.1 | Completed | / |
| P | Week Report (wiki Logbook) 12th Week Report (2019-05-20 to 2019-05-24) | Alex | 0.1 | 0.1 | Completed | / |
| 107 | Thermal insulation - electronic components in the pillow | Alex, Elien, Ko | 0.4 | 0.4 | Completed | / |
| 144 | Check the wiki where it says humidity and replace it for HR | Alex | / | / | Not Completed | Wiki needed to be refined first |
| 127 | Water proof but not air proof for the cover of electronic components in the pillow | Alex, Elien, Ko | 0.6 | 0.6 | Completed | / |
| 153 | Solidworks drawings for the 3D printing – rigid cage for the pulse sensor | Ko | / | / | Not Completed | Problems while printing |
| 155 | Solidworks drawings for the 3D printing – flexible part for the sock | Ko | 2 | 2 | Completed | / |
| 154 | Solidworks drawings for the 3D printing – flexible part for the pulse sensor | Ko | 2 | 2 | Completed | / |
| 159 | First tests on the IoT platform | Marcel | 2 | 2 | Completed | / |
| 160 | Refine the manual | Elien | 3 | 3 | Completed | / |
| Sprint Velocity | 14.9 | 15.9 |
| PBI/P | Task | Assignee | Planed effort [days] | Needed time [days] | Status | Reasons why tasks were not completed |
|---|---|---|---|---|---|---|
| 144 | Check the wiki where it says humidity and replace it for HR | Alex | 0.1 | 0.1 | Completed | / |
| 153 | Solidworks drawings for the 3D printing – rigid cage for the pulse sensor | Ko | 1.5 | 1.5 | Completed | / |
| 102 | Poster | Elien | 2 | 2.5 | Completed | / |
| 163 | Coordination of 3D printing of the Home Station and Sensor Casing | Ko | / | / | Not Completed | Printing parts still need to be smoothed with acetone |
| 84 | Wiki - Documentation of Tests and Results | Marcel, Tobias | 8 | 8 | Completed | / |
| 39 | Draft version of the paper in Overleaf/LaTeX | Alex | 3 | 3 | Completed | / |
| 162 | Table List of Requirements | Tobias, Vaido | 8 | 8 | Completed | / |
| 158 | First version of the video | Elien | 4 | 5 | Completed | / |
| P | Prepare the meeting with supervisors - 12th Meeting (2019-05-30) | Alex | 0.1 | 0.1 | Completed | / |
| P | Sprint analysis - Sprint 9, 23-05-2019 to 29-05-2019 | Alex | 0.6 | 0.6 | Completed | / |
| P | After meeting with supervisors - 12th Meeting (2019-05-30) | Alex | 0.1 | 0.1 | Completed | / |
| P | Week Report (wiki Logbook) 13th Week Report (2019-05-27 to 2019-05-31) | Alex | 0.1 | 0.1 | Completed | / |
| Sprint Velocity | 27.5 | 29.0 |
| PBI/P | Task | Assignee | Planed effort [days] | Needed time [days] | Status | Reasons why tasks were not completed |
|---|---|---|---|---|---|---|
| 163 | Coordination of 3D printing of the Home Station and Sensor Casing | Ko | 4 | 5 | Completed | / |
| 92 | Final conclusion chapter - Discussion | Ko | 0.5 | 0.5 | Completed | / |
| 93 | Final conclustion chapter - Future Development | Ko | 0.3 | 0.5 | Completed | / |
| 164 | Wiki review | Team | / | / | Not Completed | Waiting for chapters to be closed |
| 113 | Home station design (wiki) | Ko | 2 | 2 | Completed | / |
| 131 | Final version of the leaflet | Elien | 1 | 1 | Completed | / |
| 167 | New version of the manual | Elien | 0.5 | 1 | Completed | / |
| 166 | New version of the video | Elien | 3 | 4 | Completed | / |
| 142 | Cage for the electronic components of the pillow - structural drawing | Ko | 1 | 1 | Completed | / |
| 157 | Products by supplier and alternative suppliers | Marcel | 0.3 | 0.3 | Completed | / |
| 161 | Tests in the Physics Department and I3S - including preparation | Marcel, Tobi | 3 | 5 | Completed | / |
| 165 | Technical Specification Document – Acceptance criteria, Status and Deviation Report | Tobi, Vaido | 4 | 5 | Completed | / |
| P | Prepare the meeting with supervisors - 13th Meeting (2019-06-06) | Alex | 0.1 | 0.1 | Completed | / |
| P | Sprint analysis - Sprint 10, 30-05-2019 to 05-06-2019 | Alex | 0.6 | 0.6 | Completed | / |
| P | After meeting with supervisors - 13th Meeting (2019-06-06) | Alex | 0.1 | 0.1 | Completed | / |
| P | Week Report (wiki Logbook) 14th Week Report (2019-06-03 to 2019-06-07) | Alex | 0.1 | 0.1 | Completed | / |
| Sprint Velocity | 20.5 | 26.2 |
| PBI/P | Task | Assignee | Planed effort [days] | Needed time [days] | Status | Reasons why tasks were not completed |
|---|---|---|---|---|---|---|
| 168 | Final Presentation | Elien | 1 | 1.5 | Completed | / |
| 176 | Final Table List of Requirements | Vaido | 2 | 2 | Completed | / |
| 164 | Wiki review | Team | 6 | 10 | Completed | / |
| 174 | Graphs, images and texts about several tests | Marcel, Tobi | 6 | 9 | Completed | / |
| 175 | Images of bGuard product family | Elien | 2 | 2 | Completed | / |
| P | Prepare the meeting with supervisors - 14th Meeting (2019-06-13) | Alex | 0.1 | 0.1 | Completed | / |
| P | Sprint analysis - Sprint 11, 06-06-2019 to 12-06-2019 | Alex | 0.6 | 0.6 | Completed | / |
| P | After meeting with supervisors - 13th Meeting (2019-06-06) | Alex | 0.1 | 0.1 | Completed | / |
| P | Week Report (wiki Logbook) 15th Week Report (2019-06-10 to 2019-06-14) | Alex | 0.1 | 0.1 | Completed | / |
| Sprint Velocity | 18.9 | 25.4 |
| PBI/P | Task | Assignee | Planed effort [days] | Needed time [days] | Status | Reasons why tasks were not completed |
|---|---|---|---|---|---|---|
| 169 | Final version of the poster | Elien | 0.3 | 0.3 | Completed | / |
| 170 | Final version of the video | Elien | 0.2 | 0.2 | Completed | / |
| 171 | Final adjustments on the Tests Chapter | Marcel, Tobi | 4 | 5 | Completed | / |
| 172 | Final adjustments on SOLIDWORKS | Ko | 0.5 | 0.5 | Completed | / |
| 173 | Closing of the project with several improvements in wiki | Team | 12 | 12 | Completed | / |
| P | Sprint analysis - Sprint 12, 13-06-2019 to 19-06-2019 | Alex | 0.6 | 0.6 | Completed | / |
| P | Week Report (wiki Logbook) 14th Week Report (2019-06-03 to 2019-06-07) | Alex | 0.1 | 0.1 | Completed | / |
| P | Sprint analysis - Sprint 13, 21-06-2019 to 27-06-2019 | Alex | 0.6 | 0.6 | Completed | / |
| P | Week Report (wiki Logbook) 17th Week Report (2019-06-24 to 2019-06-27) | Alex | 0.1 | 0.1 | Completed | / |
| Sprint Velocity | 18.4 | 19.4 |
3.12 Sprint Evaluations
After every Sprint the team comes together for a Sprint Retrospective meeting. The main goal of the meeting is to figure out the positive and negative things during the Sprint period. Therefore, the strategy is continuously improved. The consequence is that mistakes are turned off and the team can work more efficiently. Table 30 shows the main points of each sprint.
| Sprints | Positive | Negative | Start Doing | Keep Doing | Stop Doing |
|---|---|---|---|---|---|
| Sprint 1, 2019-03-14 to 2019-03-20 | * Constant cooperation between team members | * Some tasks were not completed | * Better time estimation of tasks * Create “smaller” tasks, this means to be done in one week | * Productive brainstorming sessions | * Taking from the PBI to a sprint, tasks that can not be finished in one week due to lack of information |
| Sprint 2, 2019-03-21 to 2019-03-27 | * The dividing of the tasks is better than the Sprint before * The schematics and the tables for the hardware components are better than the Sprint before | * The writing skills in the wiki have to be improved | * Everyone reads the finished chapters of the other team members, to get the first feedback * Write in the passive voice * Write “Wi-Fi” instead of ““Wifi” * Write for example “1 to 10 000” instead of “1-10.000” * Write a paragraph to each figure and table * Each picture which is not done by the team should have a reference | * Working on the Wiki Chapters * Decide what the actual shapes of the products are | / |
| Sprint 3, 2019-03-28 to 2019-04-03 | * Everybody has focused on the interim report | * Not every team member is present and/or on time at the weekly meeting with the supervisors | * Write for example “2019-04-06” instead of “06.04.2019” * Write for example ”[mm]“ instead of ”(mm)“ Write ”;“ in each line after ”:“ and then ”.“ at the last line | * Writing every progress on the wiki | * Not being present and/or on time in the weekly meeting with supervisors |
| Sprint 4, 2019-04-04 to 2019-04-10 | * Excellent team cooperation to prepare the interim presentation * Interim Report was finished and uploaded in time | * Some tasks are not yet well divided between the team members \\* Some chapters in the interim presentation were too long just for one team member | / | * Writing every progress on the wiki | / |
| Sprint 5, 2019-04-11, 2019-04-23 and 2019-04-24 | * Very good feedback from teachers and supervisors on the interim presentation * Some updates were already done in the report based on the feedback from supervisors and teachers | * Not every team member is present and/or on time at the weekly meeting with the supervisors | * Update more chapters of the report based on the feedback | * Writing every progress on the wiki | * Not being present and/or on time in the weekly meeting with supervisors |
| Sprint 6, 2019-04-24 to 2019-04-30 | * More chapters were refined based on the feedback * First images of bGuard app were done | * Not every team member is present and/or on time at the weekly meeting with the supervisors | / | * Writing every progress on the wiki | * Not being present and/or on time in the weekly meeting with supervisors |
| Sprint 7, 2019-05-02, 2019-05-03, 2019-05-13 to 2019-05-15 | * Very good feedback from the supervisors about the images of bGuard app * The first version of the paper was finished in time | / | * Thinking in the information the manual must have | * Writing every progress on the wiki | * Not being present and/or on time in the weekly meeting with supervisors |
| Sprint 8, 2019-05-16 to 2019-05-22 | * Nice looking of the first version of the manual | Not all sensors are working properly | * Write in the passive voice | * Writing every progress on the wiki | * Not being present and/or on time in the weekly meeting with supervisors |
| Sprint 9, 2019-05-23 to 2019-05-29 | * Now all the sensors are working properly | / | / | * Writing every progress on the wiki | / |
| Sprint 10, 2019-05-30 to 2019-06-05 | * Poster is great | / | * Write in the passive voice | * Writing every progress on the wiki | / |
| Sprint 11, 2019-06-06 to 2019-06-12 | * Video is great * IoT platform is great | / | * Write in the passive voice * Write 100.00 € instead of €100.00 | * Writing every progress on the wiki | * Not being present and/or on time in the weekly meeting with supervisors |
| Sprint 12, 2019-06-13 to 2019-06-19 | * The effort of the team concerning the sensor testing | / | / | * Writing every progress on the wiki | / |
| Sprint 13, 2019-06-21 to 2019-06-27 | * We are positive that we have done a great project | / | / | / | / |
3.13 Conclusion
This study allowed the team to define the limits of the project but also to determine an optimal management strategy. The scope and the Gantt Chart gives the team an overview of the deadlines and deliverables. By making a risk analysis the team is able to minimise the risk. The main risks are based on time management. Hence, the team has to take care of the planning and documentation of the Sprints. Furthermore, the Scrum method gives the team the opportunity to change tasks fast and improves the work of the team continuously. So the team can save time, lows the costs of developing and also keep the quality of the product high. The early analysis of the people, costs, stakeholders and communication has also an impact on the success of the project. It is the basis for the following marketing strategy.
4. Marketing Plan
4.1 Introduction
Marketing is the targeted and target group oriented lining up of a company to the needs of the market. Thus, marketing is much more than advertisement or sales which most people associate with it. In the development process of a new product, marketing has a significant role in success. Customer orientation should nowadays not only be an abstract idea in books – it should be lived in the company. Processes should always be verified to be important for the customer. The balance between demand-pull and technology-push has strongly shifted toward demand-pull in recent years [79].
“Customers don't buy products – they buy benefits.”
Therefore, the benefit for the customer should always be in the focus during the development process. It is absolutely necessary to know the customer, the market and especially the future customer. At the end of this chapter, the team wants to have a proper market and customer analysis to have the opportunity to create a solid Marketing Mix where either price, product, place or promotion are defined.
4.2 Market Analysis
The Market analysis will define the work environment, the market situation and the (future) position in it. Thus, it will give the team input for the Strengths, Weaknesses, Opportunities and Threats (SWOT) analysis. The main questions that will be answered in the market analysis are: Who are the potential customers and what are their buying and shopping habits? How many of them are there, how much will they pay and how can the product reach them? What may be the best pricing/promotion/place strategy? Who is the competition?
Therefore, the market analysis actually helps to reduce the risk by understanding the potential market and customer conditions. It gives the team the opportunity to develop a viable product and gives input to recheck the situation during the development process and focus the resources on the strengths or to alleviate our weaknesses.
Figure 9 shows that the market analysis is divided into 3 levels:
- The macro-environment;
- The meso-environment;
- The micro-environment.
Macro- and meso-environment are part of the external analysis. The microanalysis will be an internal analysis.

4.2.1 Problem Statement
The problem statement of the project focus on worried parents and SIDS. Based on the problem statement, an agile and modern way to define the requirements specifications is phrasing User Stories, so product requirements can be simply abstracted. Table 31 includes a set of User Stories referring to bGuard.
| ID | User Story |
|---|---|
| 1 | As a parent I want to have a special pillow for my baby so that he/she does not roll from back to tummy. |
| 2 | As a parent I want to have sensors to monitor my baby so that the risk of SIDS is reduced. |
| 3 | As a parent I want to have a microphone near my baby so that I know if he/she is crying and also that he/she can listen to his/her parents' voice or music. |
| 4 | As a parent I want to have room sensors to measure CO2, relative humidity and temperature so that my baby and also the parents have a good indoor air quality. |
| 5 | As a parent I want to have all sensors connected so that I can have the information centralized. |
| 6 | As a parent I want to have the information in one platform so that I can see/hear alarms. |
| 7 | As a human being I want a sustainable product so that I don’t burden the environment unnecessarily. |
| 8 | As a customer I want to have a good product quality so that I can rely on the product. |
| 9 | As a parent I want a pillow that has an adjustable ground layer so that is suitable for different sizes of babies. |
| 10 | As a parent I want to remove the cover of the pillow so that I can wash it. |
| 11 | As a parent I want that the pillow has an anti-allergic cover so that my baby does not have health problems. |
| 12 | As a parent I want to have no Wi-Fi right next to my Baby so that there is no health risk. |
| 13 | As a parent I want to have a user-friendly software so that it is easy to use. |
| 14 | As a parent I want to have a safe software so that I can be sure to be notified when something is wrong. |
| 15 | As a parent I want to order the product easily on the internet so that the product will be delivered easy and fast. |
| 16 | As Sleepsense I want to have a good product and produce cheap so that I have the opportunity to earn money. |
4.2.2 Internal Analysis
The Internal Analysis will stick to the micro-environment and will especially result in the SWOT analysis of our team. The strengths and weaknesses of the team and the project are defined. Mckinsey’s 7S model is used for analysing the micro-environment.
7S Model of McKinsey for Micro-Environment
McKinsey's 7S Framework is used as a tool to make sure that all parts of an organization work in harmony to achieve development success. The basic premise of the model is the need for seven internal aspects of an organization to be aligned to reach success.
The McKinsey 7S model involves seven interdependent factors which are categorized as either “hard” or “soft” elements represented in Figure 10. The model shows the interdependency of the elements and how a change of a single element affects all the others. The Shared Values element is placed in the middle surrounded by all the others. It is a central factor and the key to developing all the other critical elements[81]. “Hard S” refers to strategy, structure and systems, while the “Soft S” include skills, staff and style.

The 7S model is most often used as an internal organizational analysis of micro-level to assess and monitor changes in the internal situation of an organization. It provides input for strengths and weaknesses considered in the SWOT analysis. It can help to analyse the current internal situation or a proposed future situation. So possible inconsistencies can be detected.
The model is based on the theory that, for an organization to perform well, the seven elements need to be aligned and mutually reinforced. Therefore, the model can be used to identify what needs to be realigned to improve performance [83].
In the following, it is analyzed how our team is applying and identifying teamwork with these 7S.
Hard Elements
Strategy - Purpose of the business and the way the organization seeks to enhance its competitive advantage.
The team has different experiences and capabilities. Moreover, the team members have a different educational background which gives a wide horizon of know-how. A lot of communication and coordination is our key to success. The main strategy is to use everybody's capabilities to achieve the best possible result.
Structure - Division of activities and coordination mechanisms.
Due to the different experiences, know-how and specialities, some tasks are divided. But still, everybody is included in decision processes and also somebody may have more experience with several tasks, only communication and openness are key to succeed and outgrowth. The different team members' capabilities are optimized by respecting the inherent diverse work methods.
Systems – Measurement procedures, reward and resource allocation.
In every supervisor-meeting on Thursdays, the team presents the progress and results. Doing this, the opportunity is given to get constant feedback and the operation can be adjusted. Furthermore, the team can work in an agile manner. Results are immediately written down in the wiki to be always up to date. During the working process, Google-Drive is used to make everything for everybody available and also to work on the same issue simultaneously.
Soft Elements
Shared Values - Corporate culture and work ethic.
The team is motivated, multicultural and multilingual. Every team member has a different speciality. By using those values the team is able to develop a remarkable project and create a great product.
Skills - The organization's core competencies and distinctive capabilities.
The team members are coming from different fields of study. All of them are somehow connected to engineering. Marcel Pasternak and Alexandre Reis: Mechanical Engineering, Elien Gielen: Product Development, Vaido Sooäär: Electrical Engineering, Ko Wopereis: Industrial Product Engineering and Tobias Schneider: Biomedical Engineering. Moreover, the members are coming from 5 different countries. All of them are part of the European Union and are industrialized countries. Except for Alexandre, each team member has a working environment which is different from home.
Staff - Team members and their general capabilities.
Although everybody has different main focuses on the work, the team members are integrating everyone in every work field and discuss in the group and make decisions together.
Style - Typical behaviour patterns of key groups, such as managers, and other professionals.
When working in the project, teamwork is very important. For this reason, the team has no hierarchy. This maintains an open communication atmosphere.
4.2.3 External Analysis
The External Analysis will deal with the meso- and the macro-environment. To do that, Porter's Five Forces model (Figure 11) and Political, Economic, Socio-Cultural, Technological, Environmental and Legal (PESTEL) analysis (Figure 14) are used. The External Analysis will especially result in the opportunities and threats of the market and will give input for the SWOT analysis.
4.2.3.1 Porter's Five Forces Analysis For Meso-Environment
As presented in Figure 11 the Porter's-Five-Forces is a powerful competitive analysis tool to determine the principal competitive influence in a market. In the next paragraphs, the five forces of bGuard are analyzed considering this tool specifications. Furthermore, the strengths or weaknesses of our strategy are examined. Opportunities to strengthen the organization's position compared to the other players for reducing the competitive pressure as well as generate competitive advantage can be stated. Thus, an additional input for the SWOT analysis is given [84].

Threat of new entrants
The Threat of new entrants is a threat for every company affecting the competitive environment. New competitors always have the ability to directly influence the profitability of a company. Competition is one really important factor for quality, progress and pricing on a market. In the case of the team, a threat of new entrants is given. In the Moment the project team is a new company entering the market. However, the idea of smart products is really a trend and attractive to companies. Besides, the Baby market is really attractive because the willingness to buy products is usually high. If the Product is declared as a lifestyle product and not a medical product of Medical Device Regulation (MDR) the regulations and the admission are not that hard and expensive which makes entering the market cheaper and easier. As presented in the State of the Art chapter, there are a lot of different smaller companies, and not several giants, which might make entering the market more difficult. Also, the price of microcontrollers and sensors is really low so that there is not a really high investment needed to enter the market.
Bargaining power of suppliers
Supplier power is one of the factors to consider when you are analyzing the structural environment of an industry using Porter's Five Forces framework. For the bGuard especially the supply of microcontrollers and sensors are important. Due to the huge demand and production of electronics, these sensors are quite cheap and should be available at all time. The product will not have a giant demand for sensors which makes the bargaining position of the suppliers better for us. Also, in the supplier market for microelectronics, the competition is hard so that the team has the ability to choose the suppliers which betters our bargaining position. Due to the plurality of possible suppliers thee bargaining position about prices is good.
Bargaining power of buyers
The bargaining power of buyers refers to the pressure consumers can exert on companies to provide higher quality products, better service or lower prices. With huge competition on the market, the source of the pressure on the company is the consumer. The company is only successful if there are consumers buying the product. To convince them to buy our product, we need unique selling points or arguments to convince them. The Health market, especially for infants, is a really sensitive market where trust in the company is the biggest selling factor. Being a company with trusting policy like a pleasant buyer or return service we want to earn that trust. Having a specific product people buy mostly only once in a lifetime a good image is an important factor for the company's success.
Threat of substitutes
The threat of substitution is about a revolutionary invention which makes our product redundant. At the moment all modern devices are built smart and with microcomputer technology. A permanent monitoring of the baby by implanted devices can be a possible future technology. Still, there are a lot of ethical questions to be answered. Also, there can be a trend away from monitoring back to conservative methods. Anyway, creating a product dealing with the health of the baby goes hand in hand with the trust of the buyer. Therefore ethical correct, sustainable and reliable acting is even more important. At the moment the threat of substitutes is quite low but still, continuously research and development are important to always be able to deliver an up to date product.
Rivalry among existing competitors
An important part of the market economy is competition on the market. This makes companies improve continuously and invest in research and development. As pointed out, we do not have any direct competitors in our niche yet, hence we do not need to worry about the competition at the moment. But the team has to focus on the unique selling points to make sure the benefits are clear to every customer. Also, with a sustainable and ethical correct product, a base for the trust of the consumer in our product is built. Smart and Health devices are really trendy at the moment which makes it interesting for a lot of companies to enter. So, the team members have to be aware that other companies are trying to get in the market as well which makes research and pricing even more important. The profit potential may be decreased due to that point. As well the threat of other companies offering a better product with more benefits or a better price is always a fear to consider. The threat of substitution in an industry affects the competitive environment for the firms in that industry and influences those firms’ ability to achieve profitability. The State of the Art research enabled us to be conscious of the companies in this market. But none of the existing products has so many benefits in a single product which gives us a unique selling point. Preventing companies to enter our “gap” we have to continuously invest in research and development to ameliorate our product.


4.2.3.2 PESTEL Analysis for Macro-Environment
With the PESTEL analysis the biggest influencing factors of the macro-environment are analyzed. Specific market conditions, possible market developments can be described so that you get a sound decision-making basis for the management. The macro-environment influences greatly the strategy of the company on the market. The overall company surroundings are analysed in the PESTEL-Analysis presented in Figure 14. It analyses which future trends could change the demand and market behaviour [87].

POLITICAL ASPECT
The smart pillow is supposed to be sold in industrialized and democratic countries. It will be first available in Europe and to be expanded to America and Asia.
Opportunities:
- The EU holds a free trading zone;
- Using recyclable and local materials complies with the EU legislation. This gives us both a unique selling point and a sustainable product;
- Complying with national and international regulations increases the product value.
Threats:
- Brexit makes us no more selling products in the free trading zone and either we lose a market or prices increase because of taxes;
- Regulatory affairs are expensive and take a lot of time especially in the USA.
ECONOMIC ASPECT
Opportunities:
- Parents are usually ready to invest money for the well-being of their baby;
- Smart devices are popular and used a lot especially by young people. These young people and possible parents are our target group.
Threats:
- The baby market is attractive;
- Our price will be quite high so competitors can compete and maybe offer lower prices.
SOCIAL ASPECT
Opportunities:
- People are getting children later in life, which means the ability to buy may be larger because older people usually have more money;
- The opportunity to lower the risk of SIDS may make people invest in technology because it is still an unsolved problem;
- The awareness about sustainable and ethical products increases in industrialized countries;
- The awareness about health is increasing.
Threats:
- The monitoring of their kids may be threatening for some people so that there is not the expected willingness to buy the product.
TECHNOLOGICAL ASPECT
Opportunities:
- More and more people are using smart devices and the trend goes up;
- Using technology for minimizing risks of health issues is becoming more and more common;
- The technological gap between western countries is getting smaller and smaller.
Threats:
- In our prototype some features which are important for the consumer may not be feasible;
- Health issues of radiation (Bluetooth or Wi-Fi) can be discovered.
ENVIRONMENTAL ASPECT
Opportunities:
- Making the pillow, the sock and the home station easily disassembled.
Threats:
- Nothing relevant.
LEGAL ASPECT
Opportunities:
- Nothing relevant.
Threats:
- There may be hard regulations of EU or Food and Drug Administration (FDA) in the USA especially for babies;
- Because of producing and developing in Europe the labour law is quite strict and wage is comparatively high.
4.3 SWOT Analysis
The aim of a SWOT analysis is to specify the objectives of the project and to identify internal or external factors that are favourable or unfavourable achieving those objectives. Strengths and weakness are frequently internally-related, while opportunities and threats commonly focus on the external environment [89].
To be more specific we have considered a SWOT analysis for both the product and the team.
4.3.1 Team SWOT Analysis
In the following, the SWOT Analysis of the Team can be seen in Figure 15.

internal
Strengths:
The ambitious team has different educational backgrounds, different experiences and capabilities. This gives a wide horizon of know-how. Other strengths are communication and teamwork.
Weaknesses:
Coming from different countries English is a foreign language for all of the members. Thus, communication is sometimes more difficult than talking to each other in the mother tongue. Most of the members have no experience with the development of a project this big. Moreover most of the members are inexperienced in business.
external
Opportunities:
With the Project, the team members can gain experience in project development and entrepreneurship. Furthermore, new knowledge and improve language and soft skills can be acquired. With weekly supervision of professors with different specialities, the team gets continuously a lot of feedback and advice. With this advice, the team can weekly adjust the development of the product.
Threats:
Having different educational and cultural backgrounds the members of the team have different working habits. The main Threat is the time limitation for the development which may make problems. Having limited money capabilities development actions have to be adapted to it and maybe be downgraded. Due to the fixed surroundings of the project by the university, not all processes are optimized and some work is done twice which makes the time even shorter.
4.3.2 Product SWOT Analysis
Next, the SWOT Analysis of the product can be seen in Figure 16.

internal
Strengths:
The bGuard combines a lot of benefits for the consumer which gives the company a unique selling point.
Weaknesses:
In the development process, the team has limited money and time capabilities. Working like a startup the team do not have an existing company or development infrastructure.
external
Opportunities:
Awareness of health is increasing. Also, smart devices to monitor health are becoming more and more popular. Though it is a sensitive market which makes it important to have a good and trustful image of both the product and the company. The awareness of sustainability and ethics increases as well. To make this to the product identity, the company has another benefit to sell and another argument why people should pay the price. Due to the fact that people are giving birth to children on an older age the ability to buy such a product increases. Also, smart devices, especially for health issues, are really trendy and people require them nowadays. Because of this trend, there are a lot of existing solutions to microelectronics what makes them always available and quite cheap due to the large produced quantities. Another opportunity is that SIDS is still a frightened, unsolved problem why people ask for solutions. bGuard is the contribution to the solution. More and more people are using smart devices and the trend increases. Especially smart devices to minimize heaths issues become more and more common (e.g. Apple watch). Globalization and free trading zone give a huge number of possible customers.
Threats:
Because the market is attractive, the team has to aspect a lot of competition. As it is said before the niche is a sensitive one and image and trust are important factors. So small factors which cause damage to the company image may affect our selling much more than in other markets. Also, the monitoring of children may be a threaten some people and also the awareness of radiation as a possible danger is getting bigger. Politically, Brexit can have a serious impact on our selling. Also, the regulation in the market is quite huge which may increase the costs of the developing process. Because of the attractiveness of the market, there are a lot of competitors which makes pricing really important. Approximately the product will have quite a high price so that is to emphasize our USPs and benefits.
4.4 Strategic Objectives
Strategic objectives are statements that indicate what is critical or important in our organizational strategy. To state them the SMART criteria is used. SMART stands for Specific, Measurable, Achievable, Relevant, and Time-related. The principal advantage of SMART objectives is that they are easier to understand and to know when they have been done. Sometimes the SMART criteria are added as “SMARTER” which makes them Evaluated and Reviewed as well. It can be seen in Figure 17.

For the bGuard product the following objectives are defined:
- Build a working smart pillow prototype before 2019-06-14;
- Finish the project report before 2019-06-14;
- Find the main supplier for everything before 2019-08-14;
- Build a final product of bGuard which can go into series production before 2019-12-14;
- Make a professional website with the online shop before 2019-12-14;
- Negotiate a contract with wholesalers like Amazon before 2019-12-14;
- Generate more than 100 clicks on our website before 2019-12-31;
- Invest 5% of the sales in the advertisement to grow before 2020-06-01;
- Invest 5% of the sales in innovation before 2020-06-01;
- Increase market share to 5% in Europe before 2020-06-01.
Furthermore, an initial investment of 11 000 € is made as stated in the Budget chapter listed in Table 32.
4.5 Segmentation
bGuard is sold to the Business to Consumer (B2C) market. Knowing that the product will be sold with a mobile application we know that not everybody will be interested in buying the product or will not have the possibility to use the product. This geographical, demographic and psychological study gives a better view of who our potential customers are.
4.5.1 Geographic
Thus the supply of the product in a country depends on the number of smartphone users there. According to Smartphone as a Portable Detector, Analytical Device, or Instrument Interface the map below in Figure 18 shows the distribution of smartphone users by countries [91] where it can be seen that most smartphone users are situated in Europe or the United States Because of that, the company wants to start off small and keep the ecological footprint small. Therefore, the focus is on the European market.

4.5.2 Demographic
Taking a closer look at the map of Europe, it is shown that the distribution of wealth in Europe is not equally divided (Figure 19). Because the product is a technological product and will thus not be considered cheap, it is best to focus on the wealthier countries in Europe. According to Eurostat, 2015 [93] Western Europe can be considered as more wealthy seeing that their GDP (Gross Domestic Product) per capita in Purchasing Power Standards (PPS) is bigger than the GDP per capita in PPS when comparing with other parts of Europe.

To get a better idea of the target group, a mood board is made to create the look and feel of the type of people bGuard wants to reach. The target group is concerned parents (25 to 35 years), ranging from middle-class through upper-class, who were raised with technology and constantly rely on their smartphone (Figure 20 and Figure 21).


4.5.3 Psychological
Concerning the psychological segmentation, it is found that nowadays parents worry a lot. According to a study looking into the parental worries of 2 000 parents conducted by OnePoll in conjunction with Lice Clinics of America [95] the average parents worry about their children around 37 hours a week. Consequently, bGuard wants the parents to be able to have less stress and assure them that their kid is doing fine.
4.6 Strategy/Positioning
For the strategic choices, the outside-in approach has opted. This approach helps to identify the holes in the market and assists you in taking advantage of these opportunities. A positioning matrix (Figure 22) is created to get a clear image of what the competitors have already brought on the market. This way can illustrate where the holes in the market are found. The figure shows that there is still a gap in the sector of low to medium priced monitors that have a lot of functions. This gap is filled by bGuard.
With the help of the Porter model [96] bGuard is positioned. Porter describes three different strategies a company can use from an outside-in point of view: cost leadership, differentiation and focus strategy. The differentiation strategy is chosen by the team. This strategy focuses on differentiating the product compared to its competitors. By creating a unique product combination, bGuard stands out from the crowd. Because bGuard is offering a unique product with an unseen combination of parameters, the potential customers are willing to pay more.

A detailed analysis of the competitors and the existing solutions can be seen in Chapter 2.2 Existing Solutions listed in Table 4 and below.
4.7 Adapted Marketing-Mix
The 4 P’s Marketing Mix is a tool to translate the marketing strategies based on the analysis of the chapters before into concrete actions. It focuses on the product, price, place and promotion as you can see in Figure 23.

Product
The bGuard combines multiple benefits for the customer. Therefore bGuard contains a home station measuring environmental parameters and being the Wi-Fi source for App connection. The pillow has a tummy-roll-prevention shape and contains speakers for interaction with the child and connects via Bluetooth to the home station. Moreover, the product is a sock which measures and monitors the heart activity of the baby. Especially the combination of all that is unique on the market. To keep a hygienic standard the pillow has a washable surface and is adjustable.
Price
In the State-of-the-Art chapter, the competitors are also compared concerning the prices. Most of the comparable products vary between 113.00 € and 313.00 €. Figure 22 shows that the bGuard wants to position multifunctional and in the middle-upper price segment. The estimated price should be around 249.00 €.
Place
Having a smart product, the target group is familiar with online shopping. Due to that bGuard should only be sold on the internet on our own website which makes us safe money negotiating with big warehouses or resellers. This saved money is to be invested in advertisement and promotion. Because our website is our main promotion it has to work properly and the logistics have to work as well so that the customer is satisfied at the end.
Promotion
Our target group are parents of a newborn with a high income. This target group is familiar with internet and social media like Facebook and Instagram. Therefore, social media will also be considered for promotion. Additionally, parents of first-born children are usually really careful and want the best for their kids. Being present at baby exhibitions would directly touch our target group as well.
Our Promotional Claim is “Sleepcurity for your Baby”. This Slogan intends to increase awareness and to give the customer an idea of what his benefits are when he buys the product.
4.8 Budget
Table 32 shows the division of the marketing budget being calculated with 11 000 €. Regarding our target group, the main promotion will be digital. It can be assumed that people who buy this smart product are familiar with online shopping and will be reached by online advertisement best. The Facebook, Instagram and Google advertisements are paid by clicks. This means when the budget is achieved the advertisement is not visible anymore. That's why after having spent the first amount of 11 000 € the promotion budget will be 5% of our sales as it can be seen in 4.4 Strategic Objectives. To provide the customers with the best possible service the team will spend 3 000 € to create a good website and customer service. Because we are selling our product online, consumers need the best possible comfort buying the product online and the website has to work properly instead this feels unprofessional and might have an impact on our reliability and image. Our product is to be sold in industrialized European countries. The digital promotion has to be precise for a specific country. Because of the high average income and the willingness to buy in Germany and the United Kingdom, Google, Youtube, Instagram and Facebook promotion is focused on these countries. With the investment of 11 000€, we want to increase the awareness of our product by 40% according to our target group. More than four-fifths of businesses (81%) spend at least $ 50 000 on digital marketing each year[98]. Therefore 11 000 € as an initial investment is a good amount. Also, 11 000 € is still a realistic amount in our particular case.
| Action | Price [€] |
|---|---|
| Facebook advertisement | 1 000 |
| Instagram advertisement | 2 000 |
| Google advertisement | 2 000 |
| Youtube advertisement | 1 000 |
| Website | 3 000 |
| Exhibitions for baby materials | 2 000 |
| Total | 11 000 |
4.9 Strategy Control
In an agile world acting agile in a development process is really important. Plan, Do, Check, Act (PDCA) is an iterative, four-stage approach for continually improving processes, products or services, and for resolving problems. It also includes always to recheck if the actions are beneficial for the project success. It is a continuous way to systematically test solutions, assessing results and implementing solutions which are considered good.
The four phases are:
Plan. Identify improvement potentials and establish objectives and processes required to deliver the desired results.
Do. The plan is enacted, and the potential solution is tested ideally on a small scale first. Results are measured.
Check. Study results and compare the effectiveness and decide whether the hypothesis is supported or not.
Act. If the solution was successful them implement it instead adapt it and go through the circuit again.
Figure 24 represents those four phases.

To always recheck the focus on the company goal the requirements of the customer and the market must continuously be rechecked and the actions must be adapted to them. Besides that, it is important to check if the targeting group is reached and if our promotion actions work. If not market researches can help to find out how to better reach our targeting group.
4.10 Conclusion
Based on this market/economic analysis, the team concluded to develop a pillow with a special shape - two side bumpers - to reduce the risk of rolling from back to tummy. In one of the bumpers, there will be a speaker to sooth the baby when crying. There will also be a sock to measure the baby´s pulse and finally, a home station to monitor the room air quality. The team considered the Promotional Claim “Sleepcurity for Your Baby” which increases awareness and focuses on the main benefit for the customer. Also, the team focus on the unsolved problem of SIDS and deliver solving approaches.
On the whole, bGuard will be promoted on the internet and social media, sold on the own website and due to its unique combination of features, young parents from the middle class to upwards will be willing to pay 249.00€ for its benefits.
Eco-efficiency Measures for Sustainability are framed in the next chapter.
5. Eco-efficiency Measures for Sustainability
5.1 Introduction
The project started by being based on the 3 Pillars of Sustainability [100]. Additionally, the 12 Principles of Green Engineering [101] were considered as well as the United Nations Educational, Scientific and Cultural Organization (UNESCO) 17 Sustainable Development Goals [102]. Finally, the Life Cycle Analysis [103] of bGuard was devised. In this chapter, these four sets of principles are presented in relation to our proposal.
5.2 Pillars of Sustainability
The 3 Pillars of Sustainability are shown in Figure 25.

Social Sustainability (Figure 26) is about the protection of people's health and wellness through strong legislation and maintaining access to basic resources. bGuard, is following not only legislation – maximum CO2 of 1250 parts per million (ppm) according to Portaria n.º 353-A/2013 [105] - but also recommendations from: the National Institute for Occupation Safety and Health (NIOSH) - the level of CO2 should never rise above 1 000 ppm [106],[107]; the National Sleep Foundation (NSP) - the humidity level should always be kept between 30 % to 60 % [108]; the United Kingdom (UK) National Health System (NHS) concerning room temperature – from 16 ºC to 20 ºC [109]; as also from John Mersch - the average pulse for a sleeping baby fluctuates between 80 beats per minute (bpm) to 160 bpm [110]. Concerning the cover of the pillow and the sock, they are made in Lyocell (Tencel) that is a very breathable material and is also less prone to the growth of bacteria, which means it is very hygienic [111], [112].

Re-using, reducing and recycling are the main purposes of Environmental Sustainability (Figure 27). Furthermore, it is also about integrity, natural resources and how ecosystems and air quality can be protected. Therefore, the components of bGuard were thought to be easily disassembled for recycling according to the Design for Disassembly (DFD) [114] principles. The home station can be dismantled due to its manual screw threading system. When dismantled the electronic components can be taken out for recycling. The cover textiles of the pillow and the sock are made in Lyocell (Tencel) fabrics that are naturally biodegradable and additionally during the manufacturing non-toxic solvents are used, making its production eco-friendly. On top of that, it also recycles 99% of the water used in its production [115], [116].

Economical Sustainability (Figure 28) depends on the political ideology so it is really the most problematic issue as it is hard to decide what is economically sound and the implications on businesses, jobs and employability. The bGuard concept was thought to contribute to good health and quality of life both for the baby and parents. Electronic components were chosen based not only on the price but also on accuracy and local availability. The foam [118], the cover of the pillow and the sock [119], the thermal insulation board [120] to insert in the pillow to avoid overheating and the textile [121] to protect the electronic components to the spillage of liquids, will also be bought to local manufacturers.

5.3 Principles of Green Engineering
Principle #1 Inherent Rather Than Circumstantial means that all materials as also energy inputs and outputs must be inherently nonhazardous as possible. This principle has led us to look for solutions with the lowest adverse impact possible like the textiles for the pillow and the main raw material for the home station - Acrylonitrile Butadiene Styrene (ABS) that can be recycled up to 99% [123].
Principle #2 Prevention Instead of Treatment and #3 Design for Separation were considered as well as #4 Maximize Efficiency, #6 Conserve Complexity, #10 Integrate Local Material and Energy Flows, #11 Design for Commercial “Afterlife” and #12 Renewable Rather Than Depleting. These seven principles were extremely important in the design of bGuard. For instance, the easy way parts can be disassembled on the home station, the pillow and the sock, allow to take the electronic components out in a really simple way. This means that all materials can easily be sent for recycling.
Through principles #5 Output-Pulled Versus Input-Pushed, #7 Durability Rather Than Immortality, #8 Meet Need, Minimize Excess, it was clear that some features that were at the beginning of the project were not so needed. In the research that was made looking for news about similar products, it was found an article written by Linda Carrol [124] stating that there are parameters rather complex to measure like SpO2 for instance. Based on this information the focus was really to meet the need of parents - stress relief and not giving them lots and lots of information - this means that concerning the baby we will only monitor the pulse.
Finally, it was not so easy to have so fewer components as principle #9 Minimize Material Diversity says. Nevertheless, there was, as explained before, a big focus on design for easy disassembly.
5.4 UNESCO Sustainable Development Goals
According to goal 3, Good Health and Well-Being (Figure 29), good health is about the protection from sickness and well-being concerns a state of health, happiness and prosperity. bGuard will contribute to stress relief of the parents concerning the “good health” of their baby by reducing the risk from rolling from back to tummy due to the special shape of the pillow which means a lower risk of SIDS. Furthermore, a special sock will monitor the baby's' pulse and additionally, the home station will inform the parents about the air quality of the room, so a double benefit for the “well-being” of the baby and the parents, which means “a feeling of satisfaction with life”. This information is to be completed once all the components have been decided.
One of the aims of goal 9 Industry, Innovation and Infrastructure (Figure 30) is to have innovative products or services. bGuard, as an innovative product on the market, it will not only be a pillow to reduce the risk of rolling from back to tummy - reduces the risk of SIDS - but also will allow to sooth the baby when crying with audio files from its mother for instance.
Goal 12 “Responsible Consumption and Production” (Figure 31) is about the use of products which brings a better quality of life manufactured with non-toxic raw materials, with the less possible production of waste as also that are safe and healthy while economically viable. bGuard is aimed to bring a better quality of life to the family with the minimum waste over its lifecycle in order not to jeopardise the needs of future generations. As an example, the foam of the pillow is certified with OEKO-TEX STANDARD 100 [127], class I, which corresponds to the strictest requirements, suitable for babies. The STANDARD 100 by OEKO-TEX contributes to high and effective product safety.
5.5 Life Cycle Analysis
The Life Cycle Analysis of our solution was based in five steps [129] as shown in Figure 32.

Step #1 Resource/Extraction ⇒ Components to be bought locally.
Step #2 Production/Transformation|Assembly ⇒ To be done locally.
Step #3 Distribution/Logistics|Transport ⇒ Outsourcing to logistics companies.
Step #4 Use/Operation|Maintenance|Reuse ⇒ Use of bGuard for the baby until 24 months. The home station can be used afterwards to monitor the room air quality.
Step #5 Recycling|End of Life ⇒ Easy disassembly of the home station due to its screw threading system so internal components can also be easily taken out for recycling. Pillow and sock also thought to allow to take out components without difficulty.
5.6 Conclusion
Based on this sustainability analysis, the team chose to develop a multifunctional product. bGuard is a pillow with a special shape to reduce the risk of rolling from back to tummy, with a speaker to sooth the baby when crying, a sock to measure the baby's pulse and a home station to monitor the room air quality. This innovative multifunctional product protects baby's as also parent's health (industry, innovation and infrastructure [131], social sustainability [132], good health and well-being [133]). Additionally, its components are recyclable (environmental sustainability [134], 12 principles of green engineering [135], responsible consumption and production [136], life cycle analysis [137]) and last but not least it is made with low-cost components bought locally (economical sustainability [138], 12 principles of green engineering [139]).
Thus, bGuard will contribute to relieve the stress of the parents and improve the quality of life of the family with minimum waste over its lifecycle, without jeopardising the needs of future generations.
In the next chapter, the Ethical and Deontological analysis is scaffolded.
6. Ethical and Deontological Concerns
6.1 Introduction
When launching a product nowadays it is very important to take ethical concerns into account. Ethics helps to think about doing the right thing. Ethical arguments regard the rights, interests, and wishes of all of the people who are involved. The way the team is planning to address these problems as a company will help create an image for our company, so it's important that we pay enough attention to this subject. Ethical issues are often difficult to solve because there is no black or white. The answer is often found in a grey zone, found by arguing and compromising.
It is also important to keep ethics in mind while doing our teamwork. This means that every team member is equal and has the same rights. Therefore it is important to have respect for each other and each other's opinion. The main ethical vision is based on 6 ethical principles, displayed on the diagram in Figure 33.

6.2 Engineering Ethics
Engineers have an important function in this world. They are constantly coming up with new ideas to make the world a better place and improve the overall quality of life. This means that every engineer has an ethical duty that he/she can't ignore when developing a new product. With every choice we make, it is important that we think of the consequences our decisions will have on the society, humans and the environment.
Seeing that our team mainly consists of engineers, engineering ethics is a topic we must prioritize. The National Society of Professional Engineers (NSPE), is an organization that will help us with this. The NSPE has a set of rules which every engineer should apply to his/her moral code. The NSPE Code of Ethics for Engineers is divided into three sections. The first section addresses the Fundamental Canons. This section contains six points an engineer, in the fulfilment of his/her professional duty, should always keep in account. The second part is about the Rules of Practice. It contains rules concerning the safety, health, and welfare of the public and also mentions the fact that an engineer should only serve in the areas of his/her competence. The final section is about the engineer’s Professional Obligations [140].
6.3 Sales and Marketing Ethics
Ethical marketing is shown up when the chosen marketing strategy seeks to promote honesty, fairness, and responsibility in all advertising. As said in the introduction ethics is a sensitive subject because there is no real right or wrong. This results in a set of guidelines that can be followed when a company wants to develop a marketing strategy. Sales & Marketing Executives International (SMEI) is a global sales and marketing professional association that brought out a document with eleven guidelines to Ethical Marketing [141]. The SleepSense company will keep these guidelines into account while developing and marketing our product.
It is important for a company to take these ethical guidelines into account. This way a company can develop a long and trustworthy relationship with its clients. It is a good thing when a product lives up to the expectations/claims made in the advertisement. When a company does not live up to its claims, it reflects poorly on the entire company.
bGuard wants to make sure that accurate information concerning the product is provided. Furthermore, the company wants to make sure that the customer's wishes and expectations are fulfilled. As a company, SleepSense also wants to have a fair price for our product. This means that the price should cover all the costs we made and also provide a profit for the company. But it also means that the customers can see where the price is coming from and that they agree that they get value for their money. Although the aim is to keep the price as low as possible, bGuard still has to keep in account that the employees are working in good conditions and leaving an as small as possible ecological footprint. These things will increase the selling price but create added value to the product.
6.4 Environmental Ethics
It is undeniable that technology, industry, economic expansion and population growth during the past few years has had a huge impact on the environment. All of these factors have contributed to pollution and depletion of natural resources. Also, climate change intinction of lots of animal and plant sorts is happening because of the increasing amount of people. Environmental ethics is all about including the rights of fauna and flora in our ethical and moral values. Even if the human race is considered the primary concern of society, animals and plants are in no way less important.
The company is obligated to keep our environmental footprint as small as possible. It is very important to keep the economic and ecological benefits in balance. Even more than individual people, companies have a big impact and an important role in keeping the planet a clean place. Thanks to environmental ethics the company can ensure that the environment is kept safe and protected.
On the other hand, creating a brand that has a sustainable character and is environmentally friendly can come in handy during marketing. Nowadays sustainability is a hot topic, so promoting the company as a sustainable one can definitely be seen as a strength.
During the design process, the environment is kept in mind. Moreover, the product is designed according to the design for disassembly principles. This means that when the product is at the end of its life the product can easily be disassembled and the parts can be recycled. Even when building the prototype the team wants to work with materials and sensor provided by local companies [142], [143].
6.5 Liability
It is necessary to deliver a safe and user-friendly product to the customers. To assure this the team conduct a liability analysis. This analysis consists of two areas: civil and professional liability. The first regards that a company being held liable for delivering a defective product to the consumer. The SleepSense company must take full responsibility for a product defect that causes injury. It is very important that the product meets the expectations of the consumer. When an unexpected danger occurs it means that the product does not live up to the ordinary expectations of the consumer.
First of all, the team want to try and prevent any unpleasant/dangerous situations. Furthermore, bGuard is provided with a manual which carefully explains step by step how the product works. In this way, possible confusion in using the product is avoided.
The professional is is the second part of the liability analysis. In this area, it is important that the team follows the European Union's directives according to the machines, machinery and electronics. The requirements are the following:
- Machine Directive (2006/42/EC 2006-05-17) [144];
- Low Voltage Directive (2014/35/EU 2016-04-20) [145];
- Radio Equipment Directive (2014/53/EU 2014-04-16) [146];
- Electromagnetic Compatibility Directive (2004/108/EC 2004-12-15) [147];
- Restriction of Hazardous Substances (ROHS) in Electrical and Electronic Equipment Directive (2002/95/EC 2003-01-27) [148].
The first directive does not apply to our product because it regards machines. This means the product should have joined components with a least one component that is able to move. Likewise, the second directive is not applicable to our product because our voltage is lower than 50 V.
bGuard does not emit or receive any kind of radio waves so this means that the third directive does also not apply to the product.
The last two directives are applicable to the product and it is important that the team keeps these in mind during the design process. The directives should not be working restrictive, on the contrary, they should help and guide the team with developing our product. The electromagnetic compatibility directive makes sure that electrical equipment does not generate electromagnetic disturbance. Thus, the product complies to this directive. The last directive regards a restriction of the use of certain hazardous substances in electrical and electronic equipment. These are substances like Lead (Pb) or Cadmium (Cd).
6.6 Conclusion
In summary, this chapter discovered that ethical issues are inevitable when developing a product. Ethics help to think about the role in the world as a company to make the world a better place. They help to deliver a safe and environmentally friendly product that is good for the users and the world.
Concrete this means that the team wants to keep the product limited to the European market to keep the footprint small, work with local providers and design according to the Design for Disassembly (DfD) [149] principles.
Furthermore, bGuard wants to deliver a safe and user-friendly product. The aim is to ensure that users are not exposed to danger, such as causing injuries and minimise liabilities. To help the user, bGuard is to be shipped with a manual detailing operation and maintenance instructions.
Last but not least, the team envisages launching marketing campaigns to build a realistic image and promote this solution.
Above all, bGuard wants to live up to customer expectations.
The next chapter concerns the development of our project.
7. List of Requirements
The following chapter shows the list of requirements for the product and points out how the team checks the requirements.
7.1 Product Requirements Document
In the requirements specification document, the customer requirements towards to product are stated. While the Scope Statement sets how to do it the Product requirements document states in an easily understandable way what the customer wants. - it can be seen in Problem Statement.
7.2 Table List of Requirements
In the Technical Specification Document, The Customer requirements are transferred into technical solutions. The objectives should include measurable success criteria for the project.
| ID | User story | Technical requirement | Link to chapter | Acceptance criteria | Status | Deviation report |
|---|---|---|---|---|---|---|
| ID01 | As a parent I want to have a special pillow for my baby so that he/she does not roll from back to tummy. | 1. The pillow has to have two bumpers 2. The pillow has to have a ground layer 3. The bumpers and the ground layer have to be connected | Concept of the Product | 1. The size of 300 mm x 100 mm x 150 mm with an accuracy of ± 10 mm measured by folding ruler 2. The size of 520 mm x 300 mm with an accuracy of ± 10 mm measured by folding ruler 3. The bumpers and the ground layer are connected by the velcro | 1. Tested 2. Tested 3. Tested | 1. No deviation 2. No deviation 3. No deviation |
| ID02 | As a parent I want to have sensors to monitor my baby so that the risk of SIDS is reduced. | 1. Measuring heart rate with the pulse sensor 2. The pulse sensor has to be connected to ESP32 3. The program what is written in the Arduino environment has to show a pulse curve in the serial monitor 4. The program has to send data to the IoT platform Thingsboard where the pulse is represented as a bpm | SIDS Pulse Sensor | 1. BPM is compared with medical reference device ± 5 % accepted 2. The purple wire from the Hear Rate Sensor has to be connected with the ESP32 Pin 12, the red wire with 3.3 V and the black wire with the ground 3. Connect the pulse sensor and open the serial monitor for the pulse curve 4. Open the Thingsboard and see if the bpm is shown | 1. Tested 2. Tested 3. Tested 4. Tested | 1. No deviations in acceptance range 2. No deviation 3. No deviation 4. No deviation |
| ID03 | As a parent I want to have a microphone near my baby so that I know if he/she is crying and also that he/she can listen to his/her parents' voice or music. | 1. Measuring sound with the Microphone MAX4466 2. Microphone MAX4466 have to be connected to the ESP32 3. The program what is written in the Arduino environment has to show noise level in the serial monitor 4. The design of the Thingsboard Dashboard has to show if there is a noise 5. A microphone detects noise level and if it is over 80 dB it detects a cry | Microphone Interaction | 1. Calibrate the Microphone with the sound level meter 2. ESP32 Pin 12 has to be connected with the Microphone 3. When testing with the sound level meter open the serial monitor to see the noise level 4. Open thingsboard and see if the noise level is shown 5. Measures noise level with an accuracy of ± 5 % | 1. Tested 2. Tested 3. Tested 4. Tested 5. Tested | 1. No deviation 2. No deviation 3. The sensitivity of the sound level meter is higher. The average of the measured sound over a longer time is similar to the microphone 4. No deviation 5. No deviations in acceptance range |
| ID04 | As a parent I want to have room sensors to measure CO2, relative humidity and temperature so that my baby and also the parents have a good indoor air quality. | 1. Measuring Temperature with the temperature and humidity sensor DHT22 2. The DHT22 has to be connected to the ESP32 3. The program what is written in the Arduino environment has to show temperature values in the serial monitor 4. The program has to send the temperature values to the IoT platform Thingsboard with one digit after comma 5. Measuring Humidity with the temperature and humidity sensor DHT22 6. The program what is written in the Arduino environment has to show humidity values in the serial monitor 7. The program has to send humidity values to the IoT platform Thingsboard with one digit after comma 8.Measuring CO2 with the gas sensor SGP30 9. The SGP30 has to be connected to the ESP32 10. The program what is written in the Arduino environment has to show CO2 values in the serial monitor 11. The program has to send 1 CO2 value per second to the IoT platform Thingsboard 12. The design of the Thingsboard Dashboard has to show all the data in one view | Temperature Humidity Carbon Dioxide | 1. Compare the temperature sensor with the calibrated device in a range of 20 °C - 30 °C 2. ESP32 Pin 17 has to be connected with the DHT22 3. Measure the temperature and see the values in the serial monitor 4. See if the measured temperature values are shown on IoT platform 5. Compare DHT22 with the calibrated humidity measuring device in a range of 30 % - 60 % 6. Measure the humidity and see the values in the serial monitor 7. See if the measured humidity values are shown in IoT platform 8. Compare with a medical device with an accuracy of 50 ppm and calibrate software-wise (1000 ppm) 9. ESP32 Pin 22 has to be connected with the SGP30 10. Measure the CO2 and see the values in the serial monitor 11. See if the measured CO2 values are shown on IoT platform 12. See the Thingsboard interface if the all measured things are shown there | 1. Tested 2. Tested 3. Tested 4. Tested 5. Tested 6. Tested 7. Tested 8. Tested 9. Tested 10. Tested 11. Tested 12. Tested | 1. No deviation after calibration 2. No deviation 3. No deviation 4. No deviation after calibration 5. No deviation 6. No deviation 7. No deviation 8. No deviation after calibration 9. No deviation 10. No deviation 11. No deviation 12. No deviation |
| ID05 | As a parent I want to have all sensors connected so that I can have the information centralized. | 1. The DHT22 has to be connected to the ESP32 2. The SGP30 has to be connected to the ESP32 3. The pulse sensor has to be connected with the ESP32 4. The Microphone MAX4466 has to be connected with the ESP32 5. The DFPlayer has to be connected with the ESP32 6. The MiniSpeaker has to be connected with the DFPlayer 7. The pillow ESP32 has to be connected via Bluetooth to the home station ESP32 8. Home station ESP32 has to be connected with IoT via Wi-Fi | Schematic Drawings | 1. The home station ESP32 Pin 17 is connected with the DHT22 2. The home station ESP32 Pin 21 and Pin 22 is connected with the SGP30 3. The sock and the pillow ESP32 Pin 12 is connected with the pulse sensor 4. The sock and the pillow ESP32 Pin 12 is connected with the Microphone 5. The sock and the pillow ESP32 Pin 16 and Pin 17 is connected with the DFPlayer 6. DFplayer is connected with the MiniSpeaker 7. Open serial monitor to see if the connection with two ESP32 microcontrollers is established by Bluetooth 8. Open serial monitor and see if the Wi-Fi connection is established | 1. Tested 2. Tested 3. Tested 4. Tested 5. Tested 6. Tested 7. Tested 8. Tested | 1. No deviation 2. No deviation 3. No deviation 4. No deviation 5. No deviation 6. No deviation 7. No deviation 8. No deviation |
| ID06 | As a parent I want to have the information in one platform so that I can see/hear alarms. | 1. ESP32 has to be connected with Wi-Fi 2. The program what is written in the Arduino environment has to send data to the IoT platform Thingsboard 3. On Thingsboard interface when the temperature is too low it has to send push notification 4. On Thingsboard interface when the temperature is too high it has to send push notification 5. On Thingsboard interface when the humidity is too low it has to send push notification 6. On Thingsboard interface when the humidity is too high it has to send push notification 7. On Thingsboard interface when the babies heart rate is too low it has to send push notification 8. On Thingsboard interface when the CO2 is too high it has to send push notification 9. On Thingsboard interface when the babies heart rate is too high it has to send push notification 10. On Thingsboard interface when the noise information is received from the ESP32 it has to send a push notification 11. On Thingsboard interface if no data is received it has to show a notification 12. On Thingsboard interface there have to have a 24-hour history of all the data 13. All the functionalities have to be available in an application for Android and iOS | IoT Platform Thingsboard | 1. Open the serial monitor and see if the Wi-Fi connection is established 2. See on Thingsboard if the data is sent there 3. If the temperature is under 16 °C then the push notification is shown on Thingsboard interface 4. If the temperature is over 20 °C then the push notification is shown on Thingsboard interface 5. If the humidity is under 30 % then the push notification is shown on Thingsboard interface 6. If the humidity is over 60 % then the push notification is shown on Thingsboard interface 7. If the heart rate is under 80 bpm then the push notification is shown on Thingsboard interface 8. If the heart rate is over 160 bpm then the push notification is shown on Thingsboard interface 9. If the CO2 level is over 1000 ppm then the push notification is shown on Thingsboard interface 10. If the noise level is over 80 dB then the push notification is shown on Thingsboard interface 11. Disconnect the sensors from the home station ESP32 and wait for 1 minute then the push notification is shown on Thingsboard interface 12. Push on the 24 h button on ThingsBoard interface to see the 24 h history 13. The application is available for Android and iOS | 1. Tested 2. Tested 3. Tested 4. Tested 5. Tested 6. Tested 7. Tested 8. Tested 9. Tested 10. Tested 11. Unable to test 12. Tested 13. Unable to test | 1. No deviation 2. No deviation 3. The push notification has to be cleared by the user until another push notification can appear 4. The push notification has to be cleared by the user until another push notification can appear 5. The push notification has to be cleared by the user until another push notification can appear 6. The push notification has to be cleared by the user until another push notification can appear 7. The push notification has to be cleared by the user until another push notification can appear 8. The push notification has to be cleared by the user until another push notification can appear 9. The push notification has to be cleared by the user until another push notification can appear 10. The push notification has to be cleared by the user until another push notification can appear 11. The technical requirement is possible to develop with “Rule chains” on Thingsboard, but it is not realized in the prototype 12. No deviation 13. Only the concept of the application is realized in the prototype |
| ID07 | As a human being I want a sustainable product so that I don’t burden the environment unnecessarily. | 1. The product should comply with the UNESCO Sustainable Development Goals 2. Have to use local materials 3. Have to produce locally | UNESCO Local materials and produce locally | 1. Check with the UNESCO Sustainable Development Goals 2. See the material list where the materials for building the product are bought 3. At least 90 % of the home station and the pillow are produced locally | 1. Tested 2. Tested 3. Tested | 1. No deviation 2. No deviation 3. Only 70 % product produced locally |
| ID08 | As a customer I want to have a good product quality so that I can rely on the product. | 1. The home station has to resist the fall 2. The electronics inside the home station has to resist the fall 3. The material of the pillow has to resist the pulling force 4. The material of the pillow has to be water resistance 5. The foam what is used for the bumpers has to resist the pulling force | Home station | 1. The home station has to resist a fall from 2 m without losing functionalities or breaking at least 10 times 2. The electronics inside the home station has to resist a fall from 2 m at least 10 times 3. The material of the Pillow has to resist the pulling force of 135 kPa 4. The material of the pillow has to resist splashing water IPX4 5. The foam material what is used for the bumpers has to resist the pulling force of 135 kPa | 1. Tested 2. Unable to test 3. Unable to test 4. Unable to test 5. Unable to test | 1. No deviation 2. - 3. - 4. - 5. - |
| ID09 | As a parent I want a pillow that has an adjustable ground layer so that is suitable for different sizes of babies. | 1. The Bumpers for the pillow has to be adjustable | Adjustable bumpers | 1. The adjusting range for the bumpers are at least 15 cm | 1. Tested | 1. No deviation |
| ID10 | As a parent I want to remove the cover of the pillow so that I can wash it. | 1. The pillow cover material has to have a zipper 2. The pillow cover material has to be washable 3. The cover of the bumpers has to have a zipper 4. The cover of the bumpers has to be washable | Pillow cover | 1. Check if there is a zipper on the pillow cover material 2. Check the material data sheet if it is washable 3. Check if there is a zipper on the bumpers cover material 4. Check the material data sheet if it is washable | 1. Tested 2. Tested 3. Tested 4. Tested | 1. No deviation 2. No deviation 3. No deviation 4. No deviation |
| ID11 | As a parent I want that the pillow has an anti-allergic cover so that my baby does not have health problems. | 1. The material of the pillow has to be anti-allergic 2. The bumpers have to be made from a foam | Pillow cover | 1. Check the material data sheet if it is anti-allergic 2. Check the material list if the bumpers are made out of foam | 1. Unable to test 2. Tested | 1. - 2. No deviation |
| ID12 | As a parent I want to have no Wi-Fi right next to my Baby so that there is no health risk. | 1. The ESP32 in the pillow has to use low power Bluetooth 2. The ESP32 in the pillow has to use Bluetooth to send data 3. There should be no strong radiation coming out of the pillow or sock | Concept of the Product | 1. The ESP32 has a low power Bluetooth module included 2. The ESP32 has a low power Bluetooth module included 3. There is no strong radiation coming out of the pillow or sock | 1. Tested 2. Tested 3. Unable to test | 1. The ESP32 has a low power Bluetooth module included 2. The ESP32 has a low power Bluetooth module included 3. No low-frequency radiation meter available at ISEP |
| ID13 | As a parent I want to have a user-friendly software so that it is easy to use. | 1. Looking on the Dashboard of Thingsboard or the application the customer has to see all the important data simultaneously 2. When the customer clicks on the symbols the history and more precise information show up | IoT Platform Thingsboard | 1. If the Thingsboard is opened all the current values are shown 2. When the customer clicks on the symbols the history and more precise information show up | 1. Tested 2. Tested | 1. No deviation 2. No deviation |
| ID14 | As a parent I want to have a safe software so that I can be sure to be notified when something is wrong. | 1. Developers have to document everything 2. Developers have to regularly update the software and orientate on quality management requirements (ISO 13485) 3. IEC 62304 specifies life cycle requirements for the development of medical software and software within medical devices 4. Orientate on ISO 14971 risk management in medical devices 5. Orientate on IEC 60601 for the safety and essential performance of medical electrical equipment 6. Orientate on quality management requirements (ISO 13485) | Software Requirements and Regulations | 1. Implement a documentation platform accessible for everyone in the company 2. Work with Plan-Do-Check-Act Deming circle 3. Declared as lowest risk level “A” 4. Implement risk management and worst case scenarios to avoid accidents 5. Fulfill at least 75% of requirements 6. Fulfill at least 75% of requirements | 1. Unable to test 2. Unable to test 3. Unable to test 4. Unable to test | 1. - 2. - 3. - 4. - 5. - 6. - |
| ID15 | As a parent I want to order the product easily on the internet so that the product will be delivered easy and fast. | 1. The Webpage has to be on the first page of Google when you search for “Babytrackers”, “Sleeptrackers”, “bGuard”, “Sleepsense” or “Sleepcurity” 2. After the order the product should be delivered max. 3 days later | Budget | 1. Use these keywords to see if they come up on the first page of Google search 2. 90% of the customers receive their products faster than 72 h after ordering | 1. Unable to test 2. Unable to test | 1. - 2. - |
| ID16 | As Sleepsense I want to have a good product and produce cheap so that I have the opportunity to earn money. | 1. The product has to comply with all the requirements of the functional specification document 2. The producing of the product has to be as cheap as possible | Cost calculation | 1. Comply with all the requirements of the functional specification document 2. The production has to be less than €220 | 1. Unable to test 2. Tested | 1. - 2. The cost to produce the prototype is €211.55. |
After the list of requirements are established, product development can begin. During this period the conclusions of each development step are updated in the deviation report.
8. Product Development
8.1 Introduction
The project development chapter describes the whole progress of building the first prototype. First, a general vision of the product is designed with the black box, draft sketches and the architecture. After this step, the concept of bGuard is more and more precise. Therefore, the hardware components and materials are chosen. Followed by the definition of the functionalities. In this chapter the main objectives for the Product itself are defined, the concept of the infrastructure of bGuard and the functionalities of each feature are shown. Further, the development of the Solid Works model is described. Finally, the prototype can be build up, the sensors can be installed and each part of bGuard is analysed in the Tests and Results chapter.
8.2 Idea Phase
8.2.1 Architecture
8.2.1.1 Look and Feel
A mood board of similar products is created to give an idea of how the final product to look like. This mood board Look & Feel is shown in Figure 34.

Black Box Diagram is shown in Figure 35.

bGuard Structural Draft is shown in Figure 36.

8.2.1.2 Pillow & Sock - Sketches
A sketch of the pillow is shown in Figure 37.

The pillow with velcro, side bumpers and speakers is shown in Figure 38.

Sock 3D Structural Draft is shown is shown in Figure 39.

8.2.1.3 Home Station - Sketches
For the prototype of the home station it started with sketches40 of different kind of shapes to come to a final one. Because the product is for babies the shape has to be kind of ‘childish’, round and soft shapes are a prerequisite. Below are a number of sketches to give an idea of the shape of the home station.


After the team has discussed the best shape for the home station. Unanimously the team decided for the rounded shape in the left corner of sketch 3. After that, modelling in solid works started immediately. More information about further development is in chapter Prototype.
8.2.2 Cardboard Model
A cardboard model of the home station and the pillow is created. Thus, the team gets an idea about the size of the pillow and the home station. Figure 12 and Figure 44 shows the cardboard models of the product in the parents' bedroom.


8.3 Prototype
bGuard has serveral parts which are designed in SOLIDWORKS. Thus, the development of the solid parts is shown.
8.3.1 SOLIDWORKS Model Home Station
The main requirement for the home station prototype model is that it must be 3d-printable. Therefore the model has to be build up with as less possible support material as needed. As well as the electrical components have to fit perfectly in the model. To put it another way, the model is built in such a way that it is easy to remove all parts from it.To give an example of the model an exploded view is shown in Figure 45.

To prevent inconsistent values of the SGP-30 and DHT-22 as well as the heating of the sensors, the two sensors have to be separated within the casing. This is done by means of different compartments that prevent the values from being imprecise. Because they’re not in direct contact with each other, the results will be more accurate. Also for the Arduino, there are some clicks to hold it in place, and it lays off the ground area to prevent overheating as well. In the real concept, other sensors are used. The substitute for the EPS-32 is a PCB-board that’s programmed with a Wi-Fi connection and connects with the app, pillow and sock sensor. This is the heart of the product. The SGP-30 and DHT-22 will be substituted by smaller and more accurate sensors. To test how the components fit in the model, there is made a 3D-print model. It is also very important to understand how the shape looks and feel in real life. This is because, in SOLIDWORKS, the model always looks a lot bigger than it is. In Figure 46 you see how the product came out the printer with inside components.

8.3.2 SOLIDWORKS Model Sensor Casing
For the prototype of the sensor casing, there is been made a model in SOLIDWORKS. The sensor is installed in the sock to measure the heart rate of the baby. Because the prototype holds a pulse sensor compatible for Arduino, it’s different from the real concept.
The prototype consists of four parts, the first part is the sensor which measures the foot of the baby. The second two, the bottom and top parts, clamps the wire cover. This part is a shell to cover the wire of the charger. The sensor is located between the bottom and the top part. In Figure 47 you can see the prototype and exploded view Figure 48.


The concept of the sensor casing has to be resistant to water. That is why there is a piece to have something that covers the charger wire. Because the prototype has a wire that is directly connected to the Arduino, this was not an option. However recording to the charging of the concept, a lithium 3 V battery is chosen that’s rechargeable which you can connect to the home station. The sensor Figure 49 is placed into the sock which is developed and explained later in the report. In Figure 50 there is an exploded view of the product.


8.4 Materials & Manufacturing
This chapter gives an overview of all used materials for the product. Furthermore, the way of manufacturing are shown and structural drawings show the draft vision of the product.
8.4.1 Pillow and Sock
Foam
Pillows and mattresses nowadays are often made out of foams. Polyurethane foam (also known as polyfoam) is the most commonly used material when it comes to matrasses. It is a synthetic material. Similar to memory foam, polyfoam also consists of polyurethane. The biggest difference lays in the fact that memory foam contains extra chemical additives to make the mattress denser and viscose [150].
As a company, SleepSense strives to make the bGuard as “green” as possible. Therefore, a look at different, more eco-friendly solutions is taken. In plant-based foam, all synthetic materials will be replaced by plant-derived materials. Soy-based foam is made out of, as the name suggests, soybeans. The mattresses and pillows made out of this kind of foam claim to be more eco-friendly. But the truth is that these type of foams often only contain 5% to 40% of soy. The remaining percentage is still polyurethane. In other words, the soy creates a fake green image, misleading the customers and letting them believe that the product they are buying is eco-friendly. As we discussed in our ethical chapter, bGuard stands for transparency and openness towards there customers and don’t support this kind of products. This is why the team opt for making our pillow out of polyfoam [151].
Polyfoams can be divided into two different categories. The first one being the closed cell rigid polyurethane foams. These foams are created of bubbles that are continuous and completely spherical. The other category contains the open cell flexible polyurethane foams. These type of foams have cell walls that are incomplete and contain holes through which liquid and air can easily travel. Because there will be electrical components inside of our pillow it is important that it won’t heat up. The open cell structure helps make the material more breathable. Nevertheless, we will still be adding perforations to encourage airflow and prevent overheating. The perforations will also improve sound quality [152].
A known benefit of polyfoam is that it is a quiet light material. This makes it easy for the parents to transport their Smart Pillow without having to carry too much weight. For SleepSense, another good benefit is that the material is relatively inexpensive and will allow us to produce the pillow for a cheaper price.
As mentioned earlier in the sustainability chapter, our foam is labelled with the Oeko-Tex trademark. This label confirms the human and ecological safety of textiles. This during all the stages of production. Extent and requirements of Oeko-Tex testing for harmful substances depend on the intended use of a textile product. Depending on the end product and use of the end product, the Oeko uses different tests for harmful substances. They divided all products into four different categories. Our pillow falls under class I, items for babies and infants (up to 36 months of age). Furthermore, all products that are tested are obligated to have a skin-friendly pH value and good colour fastness. They are also tested for emissions of volatile chemicals [153].
Cover
As discussed earlier, the pillow will consist of polyfoam. The team wants the polyfoam to be provided of a cover, to protect the material and the sensors inside. Therefore, the team looked at different materials for the cover and found three possibilities that would be suitable for making a cover.
Viscose is the first material that will be discussed. Viscose is a material that is made from regenerated cellulose fibre. This cellulose fibre comes from plants or wood pulp. During the manufacturing process, the cellulose is chemically transformed into a viscose solution. Next, they extract the threads from these solutions and produce the fabric with these strings. Even though the process might sound harmless, it is definitely not the most environmentally friendly solution. The plants are broken down through a chemical and mechanical process - involving Sodium Hydroxide (NaOH) and Carbon Disulfide (CS2) - into a liquid, followed by a process which spins the threads using Hydrogen Sulfate (HSO4) [154].
The second option is a bamboo-based material. There are two different types of bamboo fibres. First of all, we have mechanically crushed bamboo. The manufacturing of this material doesn’t involve any chemicals, which makes it the most eco-friendly option of the two. Nevertheless, this option is not so popular because it is a more expensive option. The second type of fibre is more common. Here the bamboo fibre is chemically extracted from the bamboo stem. The chemicals and water used during this process are often not re-used, resulting in a non-eco-friendly end product [155].
Last, the material Lyocell (Tencel) is described. This material is made from cellulose that comes from wood pulp. The pulp gets chemically broken down into a fluid and reformed into more easily woven fibres. This is why Lyocell (Tencel) is often called a regenerated fibre. Lyocell (Tencel) fabrics are naturally biodegradable and additionally during the manufacturing non-toxic solvents are used, making its production eco-friendly. On top of that, it also recycles 99% of the water used in its production. Another benefit of this material is that Lyocell (Tencel) is a very breathable material and is also less prone to the growth of bacteria, which means it is very hygienic [156], [157]. All these characteristics make Lyocell the perfect material for our pillow cover.

Cool Thermic
Accidents happen easily. It is important to protect the electronic components in the pillow from possible leakage of liquids. This is why the team provides an extra protection layer around the components inside the pillow. For this, a layer of Cool Thermic is used. This material consists of 80% Polyester and 20% Polyurethane Membrane. Another big benefit of this material is that it absorbs heat when the temperature goes up and temporarily stores this energy. When the temperature decreases, the material releases this energy as heat. This is a good quality for preventing the overheating of the electrical components. Also, when manufacturing the pillow, the team members will use double sided sewing tape. The team does this to prevent making holes in the pillow which can disturb the waterproof nature of the material.
Extruded Polystyrene
Besides the use of Cool Thermic the team decided to insert a thermal insulation board between the electronic components and the bumper side closest to the baby. An extruded polystyrene board (XPS) was chosen. The largest percentage of the XPS is composed of polystyrene (PS), a thermoplastic polymer of styrene which itself is a compound of carbon and hydrogen [158].
Table 34 shows the needed materials to build the pillow and the sock.
| Nr | Item | Part of bGuard | Provider | Quantity | Unit | Unit Price [€] | Item Cost [€] |
|---|---|---|---|---|---|---|---|
| 1 | Tencel | Pillow, Sock | Flexitex | 0.75 | m2 | 2.49 | 1.87 |
| 2 | PU Foam 3035 | Pillow | A Central da Borracha | 0.033 | m3 | 237.75 | 7.85 |
| 3 | PU Foam 3049 | Pillow | A Central da Borracha | 0.00078 | m3 | 275.73 | 0.22 |
| 4 | XPS | Pillow | Fibran | 0.00005 | m3 | 182.00 | 0.01 |
| 5 | Cool Thermic | Pillow | LMA | 0.014 | m2 | 20.50 | 0.29 |
| 6 | Zippers and velcro | Pillow, Sock | Molarte | 1 | un | 8.00 | 8.00 |
| TOTAL | 18.22 |
8.4.2 Home station
The assembly of the prototype is done truly a threaded lip and groove in the top and bottom. In this way, it’s really easy to get the top off and do maintenance or replace components if needed. For the prototype, there is a printed version in PLA. But the material for the home station concept is going to be ABS.
8.4.3 Sensor Casing
The materials for the top and bottom are ABS. This has been chosen because it is colourable, durable and has a high yield strength. To connect these two parts, there are two clicks to attach them to each other. Such as the baby that is kicking his feet into the air, the wire cover is made from Thermoplastic Polyurethane (TPU). Because it is in the sock, it has to be flexible. To make the concept watertight, at the top there is a glass plate glued to the sensor and the top cover. On the end of the wire, there is also a lid to close the end of the charger.
Table 35 shows the needed materials to build the home station and the cage for the sock.
| Nr | Item | Part of bGuard | Provider | Quantity | Unit | Unit Price [€] | Item Cost [€] |
|---|---|---|---|---|---|---|---|
| 1 | PLA | Home station (bottom) | LSA | 0.05850 | kg | 21.96 | 1.28 |
| 2 | PLA | Home station (top) | LSA | 0.02848 | kg | 21.96 | 0.62 |
| 3 | PLA | Sensor case (bottom) | LSA | 0.00262 | kg | 21.96 | 0.06 |
| 4 | PLA | Sensor case (top) | LSA | 0.00262 | kg | 21.96 | 0.03 |
| 5 | TPU | Wire cover sensor case | LSA | 0.00156 | kg | 30.96 | 0.05 |
| 6 | Printing | Home station, sensor case | LSA | 1 | un | 26.45 | 26.45 |
| TOTAL | 28.49 |
8.4.4 Structural Drawings
According to DINED (anthropometric database [159]), the average length of a newborn baby is 543 mm. When the baby reaches the age of 3, he/she has grown up to a size of 974 mm. This is important data that the team need to keep in mind when designing the pillow.
The team wants a pillow to be used as long as possible. In order to do this, the pillow has to grow with the baby. Therefore the width of the pillow is adjustable according to the width of the baby. The width of the baby expands up to around 200 mm. This means the design has to make sure that the width of the pillow can be adjusted up to around this distance. On the ground layer of the pillow, two strips of velcro have placed that stick to the velcro on the bottom of the adjustable side bumper. A big benefit of making it adjustable is that it makes the product more sustainable because there is no need to buy a new pillow when the baby starts growing.
The pillow consists of a thin ground layer with two side bumpers. One of the bumpers is stationary the other one is adjustable. The stationary side bumper is the one with the cry detection sensors and speaker inside. To make sure that the sound quality is good we made perforations in this bumper to make the sound come out better. On the bottom of this bumper, there is a small groove where the sensors and speaker are placed in. This way they can easily be replaced or fixed when broken.
Pillow 2D Structural Draft is shown in Figure 53.

Home Station 2D Structural Draft is shown in Figure 54.

Sensor casing 2D Structural Draft is shown in Figure 55.

8.5 Concept of the Product
Figure 56 shows the graph of the concept of the vision of the final product. On the left-hand side are the sock and the pillow. Like said in Designs, the pillow has two side bumpers. They low the risk of rolling from back to tummy. Furthermore in the pillow is a microphone and a speaker included. In combination with the MP3 player, the pillow can play music or voices, when the infant is crying. Moreover, there is a pulse sensor included in the sock. To save money for the prototype, the sock is connected with wires to the micro-controller of the pillow. In the vision of the end product, the sock has a smaller textile micro-controller with a small battery included realizing a wireless connection.
The sensor data of the sock and the pillow is delivered by Low Power Bluetooth to the home station, which is in the center of Figure 56. In this part of the product the values are received and temperature, humidity and CO2 are measured.
After this step, all the sensor data of the pillow, the sock and the home station are saved on IoT platform, which is shown on the right side of Figure 56. The measurements are sent by Wi-Fi from the Home Station. Finally, the data can be monitored online and seen on a smartphone application. In the case of a risk of the baby or the environment, a notification can be sent through the application. Because of the limited time and budget, the application will be not realized for the prototype. Nevertheless, the measurements are monitored on an open source IoT platform to prove the concept. The diagrams are available on an online dashboard. Furthermore, a concept of the application is designed.
bGuard doesn´t want to emit high radiation to the infant in the first months after its` birth. Therefore the team decides to send the measurements by Low Power Bluetooth to the home station. The some station is positioned in the sleeping room of the baby. SleepSense recommends putting the home station as far away from the sleeping area as possible. In addition, the interval of the sending and receiving processes will be 30 seconds. In this way, there is no long-term radiation.


The following image gives you an idea of what the bGuard product family will look like Figure 60.

This image shows the prototypes of our product family Figure 61.

8.5.1 Mobile Application
bGuard is supported by a mobile phone application. Here are the measurements by the smart sock and home station gathered. The app provides an easy and visual overview for the parents to see how their baby is doing. It shows if the measured values are inside of the safe range.
Baby's pulse fluctuates according to Table 36 [160]. The average pulse for a sleeping baby fluctuates between 80 Beats Per Minute (BPM) to 160 BPM [161]. As the babys' date of birth will be inserted on the settings section of the app, a notification if the baby's pulse does not fall inside this range will be sent to the parents.
| Age | Awake Rate | Sleeping Rate |
|---|---|---|
| < 28 days | 100 BPM to 165 BPM | 90 BPM to 160 BPM |
| 1 month to 12 months | 100 BPM to 150 BPM | 90 BPM to 160 BPM |
| > 12 months to 24 months | 70 BPM to 110 BPM | 80 bpm to 120 BPM |
The temperature of the baby's bedroom is also an important factor. The United Kingdom (UK) National Health System (NHS) advises that the room temperature should be from 16 ºC to 20 ºC [162].
Concerning the humidity, the humidity level should always be kept between 30 % to 60 % [163], [164]. A percentage higher than 60 would mean that the risk of mould growth increases. Mould growth can lead to respiratory complaints like asthma.
The home station will also be monitoring the level of CO2. High CO2 levels in a bedroom are associated with dry mouth and skin, low air freshness and may even lead to an unstable mental state. On top of that, rising CO2 levels mean that the level of volatile organic compounds (VOCs), odours and micro-organisms in the bedroom also rise. The National Institute for Occupation Safety and Health (NIOSH) states that the level should never rise above 1 000 ppm [165], [166].
The application will also allow the parents to interact with their baby. The pillow will be equipped with a cry detection sensor. This sensor measures the sound level in decibel (dB) the baby produces. When the threshold of 80 dB is exceeded the sensor application will send a notification to the parents. An average baby produces 110 dB whilst crying [167].


8.5.2 Software Requirements and Regulations
Software development is a “special process” which makes it hard to verify the correctness of the process result in an economical way. Therefore, especially documentation of the software is a really important point because not only hardware defects can put a risk on the customer also software bugs. Especially if the business treats a sensible niche, like the product does, you have to make sure that the customer takes the lowest possible risk according to both hardware and software. To make sure that, standards and regulations do an important job for customers’ security. For example, International Electrotechnical Commission (IEC) 62304 specifies life cycle requirements for the development of medical software and software within medical devices. It is a European harmonized standard for medical device software that says how to accomplish a well-thought-out software development process. Unlike most other standards, the requirements of IEC 62304 are adapted to the safety relevance of the software to be developed. Security relevance is determined by a risk-based approach. The more sensitive the software is, the more effort must be made during development and documentation. For this adaptation, IEC 62304 defines three safety classes where the product would be declared in the lowest risk declaration called “A” due to the non-invasive and low voltage purpose.
Also, only Software Of Unknown Provenance (SOUP) is used in the product. Libraries are included which are not written on from the team and may not fulfil the requirements of e.g. IEC 62304 and is not documented enough and might be a security risk [168].
According to risk management in medical devices, International Organization for Standardization (ISO) 14971 establishes the requirements for risk management to determine the safety of a medical device by the manufacturer during the product life cycle.
Talking about the hardware the IEC 60601 is a technical standards regulation for the safety and essential performance of medical electrical equipment.
Although the product is not a medical product, the team can get input from regulations and good development standard due to the fact that medical devices have high requirements according to software and hardware security and as well as quality management requirements (ISO 13485). One basic idea of this standard is the Deming circle to continuously PDCA as seen for instance in Strategy Control. To ensure the best possible quality, documentation is very important.
Also, to verify a good product, requirements management including the requirement analysis documentation is very important. In the requirements specification document, the customer requirements towards to product are stated. In the technical specification document, the service provider presents in a concrete form of how he would and could implement the project for the client. In the specification, the exclusion principle is used, that is, concrete cases are either included or excluded to form the basis for further action. It is described in Quality and Functional Specifications.
According to that verification and validation, it is important to check if the product (including the software) meets requirements specifications and fulfils the intended purpose. Verification means to check if the product complies with regulations and requirements and is an internal process. Validation is to check if the product meets the needs of the customer and is an external process.
Our product is not a medical product and does not fulfil the requirements of these standards but due to the sensibility of our customers, we see those as a guideline to orientate ourselves on them [169].
8.5.2.1 How to deal with Software of unknown provenance (SOUP)
Writing a safety-critical software for medical products dealing with SOUP is always an important issue. SOUP software may e.g. be commercial or free software (commercial-off-the-shelf software, COTS software), as a common software library. SOUP software can also be a software that was developed individually, but for which no adequate documentation is available. Still, the producer is liable for the entire software. In the bGuard product, Arduino sensor libraries are included which may be a security risk due to lack of documentation. Functional Safety is divided between what it needs to perform its primary task and what it has to do to ensure that no unacceptable risk or harm to persons, property, environment is present.
But of course, the wheel does not have to be reinvented in every software development. So, Software of Unknown Provenance is regulated in IEC 62304 referring to software with unknown safety-related characteristics or developed under an unknown methodology. Operating Systems, code libraries supporting the CPU, or even artifacts created by the compiler have all led to chunks of code in a medical device application that were not written on peoples’ own and are not known for certain to be safe. When writing the firmware from scratch in assembly language even then it has to be relied on the assembler to correctly map to machine code and the processor to be bug-free.
How to avoid this risk and how to prove to the regulatory that the code is safe even if only a fraction is written on our own? Using a commercial set of tools and libraries helps. Also, deciding for widely used and tested open-source solutions is recommended. To define the word safe in a software it is important to divide the software by their safety relevance. Potential hazards have to be identified and treated separately. To ensure that the probability of failure of the hazard mitigations is exceedingly low, there are multiple ways. One important way is to lock down the particular version of the development environment and all the libraries that were chosen. Updates in libraries have the chance of bugs or give an uncalculatable security risk. Also, the testing will never have an end and would practically not be feasible. In development, there should be a pool of trustable and tested soup software that can be used for future projects to reduce development time and cost.
The scope and priority of critical variables and methods must be protected. The best way is to encapsulate that safety-relevant code in its own process or thread if appropriate. Intermediate and state variables must be kept private so they can’t be interfered with by other code. If variables contain particularly important data, then redundant storage and error checking is a good strategy. If necessary, interrupts and threads should be blocked during critical code sections. Using watchdog timers is recommended to ensure code is serviced sufficiently frequently. One option is to run code on its own processor. It’s important to clearly define critical code as separate software items in the architecture because this allows a reduced level of testing for non-critical code and helps create the isolation required in the regulation. The checking routine includes the obvious steps of bounds-checking arrays and protecting variables against overflow and underflow [170].
Adding data quality metrics must be considered and defining what actions to take when metrics don’t meet their passing thresholds. Quality checks then become part of mitigation and must be verified themselves. Not only wrong particular computations lead to incorrect results, also another thread, interrupt, process or the operating system itself or messing with memory or CPU time can be origins of errors. This becomes even more likely when the processor is pushed to the limits of memory or speed. A lot of testing for different scenarios is required. The whole point is to adequately measure the probability that mitigation will fail and show it to be sufficiently low. A goal is to test the complete set of possible inputs. Frequently this is not possible due to the vast extent of an input dataset [171].
For the bGuard prototype, this is not required because it is not stated as a medical product. But orientating on medical product regulations, software security is very important and SOUP dealing is definitely required. Also, for the final product bGuard plans to fulfil the requirements for medical products to ensure the safety of the consumer using our product.
8.6 Electrical components
8.6.1 Microcontrollers
Table 37 lists the microcontrollers. These are divided into Arduino-boards and ESP-boards.
| Microcontroller | Price [€] | Size [mm²] | Input Voltage [V] | CPU/Speed [MHz] | Analog In/Out | Digital In/Out | SRAM [kB] | Flash [kB] | USB | Wi-Fi | BT |
|---|---|---|---|---|---|---|---|---|---|---|---|
Arduino Uno [172]  | 22.90 | 52.3 × 68.8 | 7 to 12 | 16 | 6 | 14 | 2 | 32 | USB Cable A to B | No | No |
Arduino Nano V3.0 [173]  | 12.90 | 18 × 43 | 7 to 12 | 16 | 8 | 14 | 2 | 32 | Mini | No | No |
Arduino Micro [174]  | 23.00 | 17 × 48 | 7 to 12 | 16 | 6 | 16 | 2.5 | 32 | Micro | No | No |
Arduino Pro Mini [175]  | 13.78 | 18 × 33 | 5 to 12 | 16 | 6 | 16 | 2 | 32 | FTDI cable needed | No | No |
Arduino Lilypad [176]  | 18.94 | ø 50 mm | 2.7 to 5.5 | 8 | 6 | 8 | 1 | 16 | FTDI cable needed | No | No |
Bluno beetle [177]  | 13.01 | 28.8 × 33.1 | 5 | 16 | 4 | 4 | 2 | 32 | Micro | No | Yes |
Espressif ESP32 DevKitC [178]  | 8.73 | 27.4 × 54.4 | 3.3 to 5 | 160 | / | 10 | 520 | 16 Mbit | Micro | Yes | Yes |
Node MCU ESP8266 [179]  | 9.90 | 24.5 x 49 | 3.3 to 5 | 80 | / | 17 | / | / | Micro | Yes | No |
It could be possible that the team decides for a microcontroller with no included Wi-Fi or Bluetooth. Therefore, there is a list of the possible modules in Table 38 to compare the amount of the prices.


As a result of the research, the team comes to the conclusion that the “Espressif ESP32 DevKitC” is the best choice for the pillow and the Home Station. The microcontroller has a small size and is faster than the other microcontrollers. So it is not needed to buy one of the modules in Table 38. The most reason for the ESP32 is the low cost and the capability to Arduino sensors.
For the sock, the team decides, that the “Bluno beetle” is the best choice. With its small size, the micro-controller is perfect for textiles. In comparison with the “Arduino Lilypad” the microcontroller has an included Bluetooth module. This benefit saves more space in the sock and money for the Bluetooth module.
8.6.2 Baby Condition Sensors
The product monitors the condition of the baby by measuring the pulse. For that objective, there is a building kit and a solo pulse sensor for Arduino. They are shown in Table 39


The “Heart rate sensor kit” is sponsored by DFI from ISEP. Thus, the team can use it for the prototype. For the vision of the final product the team decides for the “Heart rate sensor module”. It is available in Portugal and it is cheaper.
8.6.3 Environmental Sensors
According to the Black Box Diagram in Figure 35 the team is planning to put environmental sensors into the Home Station, which is also in the bedroom. Consequently, the team divides the results of the research in Humidity and Temperature Sensors(Table 40) and Gas Sensors (Table 41).
| Module | Price [€] | Size [mm²] | Input Voltage [V] | Current [mA] | Temperature range [°C] | Temperature accuracy [°C] | Humidity [%] | Humidity accuracy [%] |
|---|---|---|---|---|---|---|---|---|
DHT22 [184]  | 11.60 | 30.1 x 10.5 | 3.3 to 6 | 1 to 1.5 | -40 to 80 | ± 0.5 | 0 to 100 | ± 2 |
DHT11 [185]  | 5.95 | 23.5 x 12 | 3.3 to 5 | 3 to 4 | 0 to 50 | ± 2.0 | 20 to 90 | ± 4 |
DHT22 Onboard [186]  | 12.50 | 39.92 x 15.40 | 3.3 to 5 | 2.5 | -40 to 80 | ± 0.5 | 0 to 100 | ± 2 |
HTU21D-F Temperature & Humidity Sensor [187]  | 13.93 | 18 x 16 | 3 to 5 | ± 0.5 | -30 to 90 | ± 1 | 5 to 95 | ± 2 |
In comparison with the DHT11 and the DHT22, the HTU21D-F is more accurate. For the vision of the end product, the “HTU21D-F” is the best choice because it saves the highest quality for the customer.
For the prototype, the team uses the DHT22. The sponsor DFI from ISEP can provide the module for the development of the prototype. Thus the team can save money from the budget. Furthermore, the use of DHT22 ensures the poof of the concept as well.
| Module | Price [€] | Size [mm²] | Types of gases | Input Voltage [V] | Current [mA] | Accuracy [ppm] |
|---|---|---|---|---|---|---|
MQ9 [188]  | 2.96 | 32 x 20 | Methane, propane and carbon monoxide | 5 | 150 | 100 to 10 000 |
MQ7[189]  | 2.31 | 35 x 22 | Carbon monoxide | 5 | 180 | 10 to 1 000 |
SGP30[190]  | 22.95 | 17.9 x 17.9 | eCO2,VOC | 3.3 to 5 | 50 | 0 to 60 000 |
MG-811[191]  | 69.90 | 32 x 42 | CO2 | 6 | 200 | 350 to 10 000 |
ADA3566 - CCS811[192]  | 33.83 | 21 x 18 | eCO2 | 3.3 to 5 | 30 | 400 to 8 192 |
Sparkfun CCS811[193]  | 31.00 | / | eCO2 | 1.8 to 3.3 | 30 | 400 to 8 192 |
The Accuracy of the methane and carbon monoxide modules is not starting with 0 ppm. Because of that, they are only for the outside area and not for the bedroom [194]. Because of that, the team decides to renounce these sensor types.
For the CO2 sensors the team decides for the “SGP30” module. It has the highest accuracy than the other sensors and it is the cheapest module.
8.6.4 Cry Detection and Speaker Reaction
One of the features of the end product will be the reaction to the crying of the baby. For that benefit, the team needs a sensor to measure the noise of the baby in dB. According to a study of the Eastern Kentucky University, the sound level of a crying infant can be between 80 and 120 dB of noise level [195]. Thus the sensor of the smart pillow has to measure in that range as well. Table 42 shows the summary of possible microphone sensors.


The “MAX4466 module” has a maximum ratio of 125 dB. So it follows the requirement of the measuring range. Furthermore, it is cheaper than the “BOB-12758 module”. In conclusion, the team decides for the “MAX4466 module”.
Moreover, the end product needs speakers and if possible an MP3 player, which plays the sounds and music of the parents. For this reason Table 43 shows an overview over these features. There is only one MP3 player for Arduino and esp micro-controllers on the market. For this MP3 player, there is the requirement that the speaker has to have a maximum power of 3 W [198]. On this aspect, the research pays attention to.


The “DFPlayer” module is the only MP3 player for the Arduino on the market. Therefore, the team makes the decision for this module. On one side the “3W Stereo Speaker” is more powerful than the “Mini Speaker”. On the other side, it is more expensive. Consequently, the team takes the “Mini Speaker” for the prototype test. For the end product, the team would choose the “3 W Stereo Speaker”, because it has a better sound quality.
8.6.5 Power Supply Calculation
As already mentioned in Microcontrollers and Environmental Sensors there are two differences between the vision of the end product and the prototype because of the budget of the project and the limited time of the semester. In the prototype, the microcontroller “Bluno beetle” for the sock is not included. The pulse sensor will be connected with the microcontroller of the pillow through wires. Moreover, the DHT22 is used for the temperature and humidity measurement for the prototype instead of the HTU21D-F.
Table 44 to table 48 are for the choice of the power supply. They are divided into prototype and vision of the final product.
8.6.5.1 Choice of the Power Supply - Prototype
| Module | Voltage [V] | Current [mA] | Power [mW] |
|---|---|---|---|
| Heart rate sensor module | 3.3 | 4 | 13.2 |
| MAX4466 module | 3.3 | 1 | 3.3 |
| Mini Speaker | 3.3 | 1 | 3.3 |
| MP3 Mini Player DFPlayer | 3.3 | 150 | 495.0 |
| Total | 514.8 | ||
| Module | Voltage [V] | Current [mA] | Power [mW] |
|---|---|---|---|
| DHT22 | 3.3 | 1.5 | 4.95 |
| SGP30 | 3.3 | 50 | 165.00 |
| Total | 169.95 | ||
Every module needs a voltage of 3.3 V. The board can handle up to 5 V. Furthermore the total value of the current is under 1 A. In conclusion, a maximum 5 V power supply with 1 A or 2 A will give enough power for each part of the prototype.
8.6.5.2 Choice of the Power Supply - Vision of the Product
| Module | Voltage [V] | Current [mA] | Power [mW] |
|---|---|---|---|
| MAX4466 module | 3.3 | 1 | 3.3 |
| Mini Speaker | 3.3 | 1 | 3.3 |
| MP3 Mini Player DFPlayer | 3.3 | 150 | 495.0 |
| Total | 514.8 | ||
| Module | Voltage [V] | Current [mA] | Power [mW] |
|---|---|---|---|
| Heart rate sensor module | 3.3 | 4 | 13.2 |
| Total | 13.2 | ||
| Module | Voltage [V] | Current [mA] | Power [mW] |
|---|---|---|---|
| HTU21D-F Temperature & Humidity Sensor | 3.3 | 0.5 | 1.65 |
| SGP30 | 3.3 | 50 | 165.00 |
| Total | 166.65 | ||
The calculation of the power supply for the final product is similar to the calculation of the prototype. Therefore a maximum 5 V power supply with 1 A or 2 A will give enough power for each part of the end product.
8.6.6 List of Hardware Components
The list of hardware components is divided into the prototype and the final vision of the product. As already mentioned in Cost the team has several sponsors. In that way, the purchase of some components for the prototype is not needed. Table 49 shows the list of Components for the Prototype. The components that are provided by the sponsors are not considered in the total costs for the prototype. Moreover, Table 50 shows the list of components for the vision of the final product. It sums up all the prices and local providers to give an overview of the possible maximum costs. The transportation costs are not mentioned in the tables because otherwise, a comparison of the total costs is not possible.
| Nr | Name | Parts | Provider | Quantity | Price per part [€] | Partital Costs [€] | Partial Costs Prototype [€ ] |
|---|---|---|---|---|---|---|---|
| DEE, ISEP (100.00 € Budget) | |||||||
| 1 | Espressif ESP32 DevKitC [202] | Home Station, Pillow | pt.mouser | 2 | 8.73 | 17.76 | 17.76 |
| 2 | Micro SD card 8GB [203] | Pillow | pt.mouser | 1 | 6.50 | 6.50 | 6.50 |
| DFI, ISEP | |||||||
| 3 | Heart rate sensor module [204] | Sock | ISEP | 1 | 22.09 | 22.09 | 0.00 |
| 4 | DHT22 Temperature & Humidity Sensor [205] | Home Station | botnroll | 1 | 11.60 | 11.60 | 0.00 |
| 5 | BreadBoard [206] | Home Station, Pillow | ISEP | 2 | 6.00 | 12.00 | 0.00 |
| 6 | Jumper Wires - Female/Female [207] | Home Station, Pillow | ISEP | 20 | 0.07 | 1.40 | 0.00 |
| 7 | Jumper Wires - Male/Female [208] | Home Station, Pillow | ISEP | 20 | 0.11 | 2.20 | 0.00 |
| 8 | PCB - board [209] | Home Station, Pillow | ISEP | 2 | 1.35 | 2.70 | 0.00 |
| 9 | 1kΩ Resistor [210] | Home Station | ISEP | 1 | 0.11 | 0.11 | 0.00 |
| Sponsor SOLIUS | |||||||
| 10 | SGP30 -eCO2 and VOC [211] | Home Station | botnroll | 1 | 22.95 | 22.95 | 0.00 |
| 11 | MAX4466 - Microphone sensor [212] | Pillow | pt.mouser | 1 | 6.07 | 6.07 | 0.00 |
| 12 | DFPlayer - MP3 mini player [213] | Pillow | electrofun | 1 | 5.45 | 5.45 | 0.00 |
| 13 | Mini Speaker [214] | Pillow | botnroll | 1 | 1.00 | 1.00 | 0.00 |
| 14 | 5V Battery [215] | Pillow | Electrofun | 1 | 5.50 | 5.50 | 0.00 |
| 15 | 5V, 2A Power Supply [216] | Home Station | Electrofun | 1 | 6.80 | 6.80 | 0.00 |
| Total costs | 144.83 | 24.26 | |||||
| Nr | Item | Parts | Provider | Quantity | Unit price [€] | Item Costs [€] |
|---|---|---|---|---|---|---|
| 1 | Espressif ESP32 DevKitC [217] | Home Station, Pillow | pt.mouser | 2 | 8.73 | 17.76 |
| 2 | Bluno beetle [218] | Sock | botnroll | 1 | 13.01 | 13.01 |
| 3 | Micro SD card 8GB [219] | Pillow | pt.mouser | 1 | 6.50 | 6.50 |
| 4 | Heart rate sensor module [220] | Sock | pt.mouser | 1 | 7.95 | 7.95 |
| 5 | HTU21D-F Temperature & Humidity Sensor [221] | Home Station | pt.mouser | 1 | 13.93 | 13.93 |
| 6 | BreadBoard [222] | Home Station, Pillow | electrofun | 2 | 6.00 | 12.00 |
| 7 | Jumper Wires - Female/Female [223] | Home Station, Pillow,Sock | pt.mouser | 20 | 0.07 | 1.40 |
| 8 | Jumper Wires - Male/Female [224] | Home Station, Pillow, Sock | pt.mouser | 20 | 0.11 | 2.20 |
| 9 | PCB - board [225] | Home Station, Pillow | electrofun | 2 | 1.35 | 2.70 |
| 10 | 1kΩ Resistor [226] | Home Station | pt.mouser | 1 | 0.11 | 0.11 |
| 11 | SGP30 -eCO2 and VOC [227] | Home Station | botnroll | 1 | 22.95 | 22.95 |
| 12 | MAX4466 - Microphone sensor [228] | Pillow | pt.mouser | 1 | 6.07 | 6.07 |
| 13 | DFPlayer - MP3 mini player [229] | Pillow | electrofun | 1 | 5.45 | 5.45 |
| 14 | Mini Speaker [230] | Pillow | botnroll | 1 | 1.00 | 1.00 |
| 15 | 3.7 V Battery [231] | Pillow,Sock | electrofun | 2 | 4.15 | 8.30 |
| 16 | 5V, 2A Power Supply [232] | Home Station | electrofun | 1 | 6.80 | 6.80 |
| Total costs | 128.13 |
8.6.7 Schematic Drawings
After choosing the components schematic drawings of the prototype are made. Figure 65 shows the Schematic drawings for the components inserted in the Home Station.

Figure 66 shows the schematic drawing of the components that are inserted in the pillow & sock.

8.7 Tests and Results
In the following, all parts of bGuard are installed, tested and evaluated.
8.7.1 Pressure simulation of the Home Station in SOLIDWORKS
The material for the home station concept is going to be ABS. This material is strong enough to hold a force of 100 N on top without bending too much or breaking it. The reason for 100 N is because the model has to fall from two meters without breaking. However, the model is only 58 g so when it falls from two meters, it will probably only reach a force of 50 N. This is the reason of a safety factor of two what makes 100 N. A SOLIDWORKS test has been carried out to prove this. See Figures 67 and 68. The images show that when there is a force of 100 N on the top of the ABS. The displacement 68 of the material is only 0.338 mm on the most loaded point. Normally, you can't consider this to be anything. The von Mises stress equivalent in the product shows the same result.


8.7.2 Temperature and Humidity Sensor
To measure the temperature and the humidity we used the DHT22 Sensor. This sensor consists of humidity sensing component, a Negative Temperature Coefficient (NTC) thermistor and an Integrated Circuit (IC)) on the back side of the sensor. For measuring humidity they use the humidity sensing component which has two electrodes with moisture holding substrate between them. So as the humidity changes, the conductivity of the substrate changes or the resistance between these electrodes changes. This change in resistance is measured and processed by the IC which makes it ready to be read by a microcontroller [233].
Measuring the temperature works using an NTC thermistor. As the term “NTC” means “Negative Temperature Coefficient”, which means that the resistance decreases with the increase of the temperature. A thermistor is a variable resistor that changes its resistance with the change of the temperature. These sensors are made by sintering of semiconductive materials such as ceramics or polymers in order to provide larger changes in the resistance with just small changes in temperature.
In the Arduino code first, the libraries of the Sensor have to be included. Furthermore, the pin for the connection to the microcontroller is established. After this step, the setup is started. The procedure begins with setting the baud rate to 115200. This action is needed for showing the values on the serial monitor of the Arduino IDE. Moreover, the DHT22 is initialized. The following loop circuit starts with the reading of the relative humidity values and temperature values in a float parameter. In the last event, the values are printed in the Serial Monitor.
When we take a look at the sensor performance we can say that typical advertised specifications for DHT22 are:
| Absolute accuracy | Repeatability | Long term stability |
|---|---|---|
| ± 2 % | ± 1 % | ± 0.5 % per year |
It is important to know that the typical accuracy is ±2 %, but the accuracy can degrade to ±5% at the two extreme limits, < 10 % and > 90 %. In the following tables we take a closer look to the accuracy of sensor:
| Parameter | Condition | min | typ | max | Unit |
|---|---|---|---|---|---|
| Resolution | 0.1 | % RH | |||
| Range | 0 | 99.9 | % RH | ||
| Accuracy | 25 °C | ± 2 | % RH | ||
| Repeatability | ± 0.3 | % RH | |||
| Exchange | Completely interchangeable | ||||
| Sluggish | < 0.3 | % RH | |||
| Drift | Typical | < 0.5 | % RH/year |
| Parameter | Condition | min | typical | max | Unit |
|---|---|---|---|---|---|
| Resolution | 0.1 | °C | |||
| Resolution | 16 | bit | |||
| Accuracy | ± 0.5 | ± 1 | °C | ||
| Range | -40 | 80 | % RH | ||
| Repeat | ± 0.2 | °C | |||
| Exchange | Completely interchangeable | ||||
| Drift | ± 0.3 | °C/year |
The following two graphs represent the error of RH (at 25°C) and the maximum temperature error.


Although the manufacturer claims in the datasheet that the DHT22 is “temperature compensated” during the factory calibration procedure, this procedure is often not that precise. This is why the temperature sensitivity of the sensor should be tested. In the following, a procedure of temperature and humidity calibration is explained.
For calibrating the sensor the method of critical relative humidity above a saturated aqueous solution can be used. This method is an often used method of controlling humidity, used in many fields. It relies on an air-tight sealed hygrometer in a vessel with a sample of a saturated solution. The concentration of the solution allows one to control the humidity of the air above that solution. Typically sodium hydroxide, sulphuric acid or lithium chloride are used. The sensor’s measurements are compared to the humidity known from published lab tests to be generated by that particular solution and help to make a conclusion. A possible source of error can be temperature and temperature stability. The relative humidity is a strong function of air temperature. For a given absolute humidity the measured relative humidity varies with temperature. As mentioned earlier this method relies on a sealed, air-tight test vessel. This means that this particular source of error correlates to the rate of change of temperature or temperature gradients within the test cell. The easiest way is to work with the natural equilibrium which the solution, vapour and air are constantly trying to achieve. The material of the vessel also has an influence on when the equilibrium is achieved. A lot of plastics, like nylon, ABS, polycarbonate and Polyethylene Terephthalate (PET), have the tendency to be hygroscopic. This means that there is another source of humidity besides the saturated solution which results in an extended equilibration time.
With high temperature, the air is able to support more vapour. This vapour will be provided by the solution that is evaporating. All of this leads to a lower measured humidity than expected. On the other side, when the temperature is falling, the vapour will condense back to the solution. This results in a higher measured relative humidity than the calibration value we are trying to achieve. The only way the equilibrium can be established is if the temperature remains stable for a period of time. Active thermal control and good air circulation are thus from big importance. Additionally, the temperature gradients in the equipment can also cause humidity variations. The thermostatic control is based on the temperature at the sensor. If there is a temperature gradient inside the cell then that can cause exactly the same error as if the temperature varied temporally.
When conducting the test it is important to pay attention to a few things. The ideal vessel has a small volume but a big surface area of the saturated solution. This way the equilibrium is likely to be achieved quicker. In some situations, dampened solids are recommended instead of a liquid solution although for particular salts this will not work. A golden mean is when both methods are combined by using a shallow pool of saturated solution with a small amount of dampened solid piled up in the middle. This way all of the liquid, solid and gaseous material phases are in contact and allow the equilibrium to be established.
Three different types of tests are conducted. First of all, a test to look at the response of the sensor to different reference humidities, all measured at a single fixed temperature. Next, the humidity is kept fixed and the temperature will be varied between 10 °C and 40 °C. Lastly, if the sensor will be used to measure the humidity under a range of varying temperatures a full bivariate calibration is needed. Over a narrow temperature range (for example 20 < °C < 30) the thermal effects are not large. However, if the sensors are to be used over a wider range (e.g. 5 < °C < 40), then the bivariate calibration would be necessary. For room humidity measurements this is not necessary.
To sum up, it is important to take into account that this experiment does not contain an external reference against which to calibrate the temperature output. This experiment relies on plotting and comparing one sensor's offset from the mean of all the other sensors. In other words, there is only a comparison between the different sensors, but it can be said that the absolute calibration seems to be good to ∼ 0.5 °C with a relative drift of < 0.1 °C over a 30 °C range. Repeatability for most of the sensors is ± 0.01 °C.
For the Temperature and Humidity tests, we went to the Instituto de Investigação e Inovação da Universidade do Porto (I3S). There the possibilities for proper temperature and humidity tests were given. In an Incubator “IKA KS 4000 ic control” the temperature and humidity were set on a constant level. With two temperature and humidity reference devices “Omega HH314A” the values were compared with the “DHT22” measurements. Every minute the values were read until ten values for one set is recorded. Afterwards, absolute and relative errors were calculated, and the accuracy of the devices was considered to calculate the uncertainty. This was realized for 30 °C, 28 °C, 26 °C and 20 °C.
The required accuracy of the temperature is ± 3 % and of the Humidity ± 5 %.

For the temperature and humidity measurements, the mean values were calculated. It is separated between two Types of uncertainties. Type A estimates based on the statistical evaluation of a series of repeated measurements. Type B is estimated by methods other than type A. For example, Calibration Certificates or results of previous measurements. For the standard uncertainty Type A is chosen. This is the best available estimation or expected value of a quantity that varies randomly with not so many measurements. It is more accurate for a small number of measurements. It is important not to consider each source of uncertainty more than once. So, if a source was included in type A determinations, it should not be considered for type B uncertainties. For the accuracy of the measurement instrument Type B is chosen. To mathematically express the uncertainty according to the input quantities it is important to understand that Y depends on a number of input quantities Xi (i = 1, 2, …, N) according to the functional relationship. the definition of the proper measurement calculation is obtained from measured values (input quantities), which is mathematically represented by a function that relates the dependent variable (Y) to the independent variables (X1, X2, … XN ). This approach is what is used in most uncertainty studies and can be termed as an analytic model approach. To Calculate the standard uncertainty of each component the experimental average standard uncertainty (Type A) is chosen. This is an average qualifier.
Rectangular distribution (Figure 72) is chosen because it is the common and more precise way to calculate the resolution of instruments or tolerances as well as guidelines of influence when only the variation limits are known (eg temperature, pressure, etc.). It is more precise for a small number of measurements and more accurate for this case. This can be seen in Figure 54 Formula 1.

The calculation of Combined Standard Uncertainty (of all components) can be seen in Figure 54 Formula 3.
Ci is the Sensitivity Coefficient for each Source of Uncertainty and is calculated by the partial derivation of the function f in order to the variable xi which is 1 in this case. The calculation can be seen in Figure 54 Formula 2.
So, for each component 'xi' it is determined, the standard uncertainty corresponding to standard deviation uxi is calculated and the sensitivity coefficient corresponding to the partial derivative of the function in the order of each component.
The factor k returns two-sided quantiles of the (Student) t distribution and is calculated using the probability veff and the degree of freedom. This degree of freedom is infinite because using a rectangular approach v is infinite. Therefore to calculate 500 Mio. is chosen. For the standard deviation, n-1 is chosen. So having ten values the degree of freedom is 9.
Although several contributions to the combined uncertainty may have distributions that are not normal separated, it is assumed that the final result (uncertainty of the measurement) has a normal distribution. This is justified by the Central Limit Theorem (TLC), provided when at least three components of uncertainty are included, gauges are independent and when the calculation took place with equivalent relative weights. In these cases, the conditions of the TLC are verified, and it can be assumed with great approximation that the probability distribution of the result is normal.
For the Calculation of the Degree of Freedom degree of magnitude in Measurement the formula of Welch-Satterthwaite is chosen and calculates veff. This can be seen in Figure 54 Formula 4.
The inverse t-Student function, which is given in Excel by “TINV (0.0455; veff)” gives us the value of k. The results of the calculation Results presentation should not be presented with more that two significant digits. The measurement result shall not include digits less significant than those of the respective uncertainty. The use of excessive numbers leads to false user confidence. The use of insufficient significant figures does not convey all valid information available. The final uncertainty of our measurement including the accuracy (known expanded uncertainty) of the device is calculated multiplying the standard uncertainty (type B normal) of the object with the declared expansion factor k [236].
| Number of formula | formula | explanation |
|---|---|---|
| 1 |  | Standard uncertainty of an uncertainty TYPE B - rectangular |
| 2 |  | Ci is the Sensitivity Coefficient for each Source of Uncertainty and is calculated by the partial derivation of the function f in order to the variable xi which is 1 in this case. |
| 3 |  | Calculation of Combined Standard Uncertainty (of all components) |
| 4 |  | For the Calculation of the Degree of Freedom degree of magnitude in Measurement the formula of Welch-Satterthwaite is chosen and calculates veff. |
The absolute error is the difference between reference device value and measuring device value. The relative error is calculated by the absolute error divided by the reference value multiplied with 100 to get the relative error in percentage.

The results for each measurement can be seen in the graphics below.


The required accuracy of the temperature is ± 3 % and of the relative Humidity ± 5 %. Therefore the values are acceptable.

The measured values are calibrated software-wise by calculating the average absolute error and subtract it from the measured value. Doing that the precision of the sensor could be improved as it can be seen in Figure 78.
8.7.3 Pulse Measurement
8.7.3.1 Electrocardiography
The Electrocardiography (ECG) is a graph with voltage over time measuring the electrical activity of the heart. The cardiac muscle re- and de-polarization during a cardiac cycle is detected. As you can see in Figure 79 the heartbeat is divided into specific phases. During each heartbeat, a healthy heart has an orderly progression of depolarization that starts with pacemaker cells in the sinoatrial node, spreads throughout the atrium, passes through the atrioventricular node down into the bundle of His and into the Purkinje fibres spreading down and to the left throughout the ventricles [237].

- The P wave represents atrial depolarization.
- The QRS complex represents ventricular depolarization.
- The T wave represents ventricular repolarization.
- The U wave represents papillary muscle repolarization.
8.7.3.2 Pulse Sensor
The Pulse Sensor works using photoplethysmography. The analogue heart pulse signal in green comes in Voltage over time and reacts on light intensity changes of the Light Emitting Diode (LED) [239]. The Pulse Sensor is directly connected to the Microcontroller working on 3.3 Volt. The Analog data of the sensor are processed by the software and finally plotted as you can see in Figure 80. The software works with 20 Hz so 20 values per second are analyzed using an Interrupt Service Routine (ISR). We are using an 8-bit onboard timer to measure the time between each beat sampling with 500 Hz. Doing that the amplitude of the heartbeat has to go over 512 at first, which is the middle of the analogue range and changes during the run to 50 % of the average last ten wave amplitudes. When the waveform rises past the thresh value, and 3/5 of the last Interbeatintervall (IBI) has passed, a pulse had occurred. In an array, the last ten IBI Values are saved. The BPM is derived every beat from an average of the previous 10 IBI times. If the signal is over a threshold, the Q-S (Quantified Self) Bool is set to true to count a heartbeat and so that the rest of the program knows a beat is found. Timer filters are included to avoid high-frequency noise. For example to avoid dichroic noise by waiting for 3/5 of last IBI. The time between each heartbeat is measured by the IBI and processed with the red line. BPM are calculated in the software and are plotted with the blue line. The green line images the pulse signal itself.

The difference is that Figure 79 shows the voltage signal of the heart. What we measure is the response to this. We are measuring the arterial pulse waveform using photoreflectance containing a photocell sensor as our pulse sensor. The wave you can see in Figure 80 is a shockwave which means it travels much faster than the actual blood. It represents the impulse of ventricular contraction. The wave can be separated into an anacrotic upstroke limb and a dicrotic downstroke limb [240]. Figure 81 shows the dependence.

The systolic upstroke does not occur immediately following the contraction of the heart. On the ECG, the electrophysiological phenomenon which signals the beginning of systole is the R wave. Usually, the arterial pulse wave does not appear on the monitors until a 160 ms to 180 ms delay. The main reason next to measurement uncertainties is that after the R wave, (the depolarization wave) has to spread through the left ventricle, some isovolumetric contraction needs to take place, then the aortic valve has to open, and then the aortic pressure wave needs to travel up the aorta and down the arm (at 6 m/s to 10 m/s). The systolic upstroke is the ventricular ejection being generated by the fast-moving 10 m/s wave and corresponds to the peak aortic blood flow acceleration at the opening of the aortic valve[242].

Therefore, the pulse wave which is measured is, apart from the heartbeat also influenced by the pressure, the contractility, aortic valve flow, arterial peripheral resistance, diastolic pressure, the pattern of the electrical activation.
The dicrotic notch as you can see in Figure 82 happens because there is a sudden increase in pressure as the valve closes. It is a secondary upstroke in the descending part of a pulse tracing corresponding to the transient increase in aortic pressure upon closure of the aortic valve [244].
Following the pulse signal is exactly as it is to be expected for a young person. The BPM values of pulse and heart rate are the same due to the characteristic that they measure the peaks.


In the following the graph of the reference medical device Silvercrest SPO55 with an accuracy of ± 2 BPM in the range of 30 BPM to 250 BPM Pulse. The error and uncertainty calculations are done the same as explained in the temperature and humidity measurement chapter before.


The required accuracy of the pulse sensor ± 5 %. Therefore the values are acceptable.
8.7.4 Carbon Dioxide Sensor
For the CO2 Sensor the SGP30 Sensor is used. It is a fully integrated MOX gas sensor. It has Inter-Integrated Circuit (I2C) interfacing and comes with fully calibrated output signals with a typical accuracy of 15 % within measured values. The SGP combines multiple metal-oxide sensing elements on one chip to provide more detailed air quality signals.
The SGP30 has a standard hot-plate Metal Oxide Semiconductor (MOX) sensor, as well as a small microcontroller that controls power to the plate, reads the analogue voltage, tracks the baseline calibration, calculates Total Volatile Organic Compounds (TVOC) and eCO2 values, and provides an I2C interface to read from. In bGuard only eCO2 is measured.
This part will measure eCO2 concentration within a range of 400 ppm to 60 000 ppm. Like all VOC/gas sensors, the SGP30 has variability and to get precise measurements you will want to calibrate it against known sources! For general environmental sensors, it will give a good idea of trends and comparison. The SGP30 does have built-in calibration capabilities, note that eCO2 is calculated based on H2 concentration, it is not a 'true' CO2 sensor for laboratory use or a medical device.
Another nice element to this sensor is the ability to set humidity compensation for better accuracy. An external humidity sensor is required and then the % RH is written over I2C to the sensor, so it can better calculate the TVOC/eCO2 values.
The first 10 to 20 readings will always be TVOC 0 parts per billion (ppb) eCO2 400 ppm. The TVOC value is not important to the bGuard product. That's because the sensor is warming up, so it will have 'null' readings. All the calculations for the TVOC and eCO2 of the SGP30 are done within the sensor itself, no other data is exposed beyond the baseline values. All VOC/gas sensors use the same underlying technology: a tin oxide element that, when exposed to organic compounds, changes resistance. The 'problem' with these sensors is that the baseline changes, often with humidity, temperature, and other non-gas-related-events. To keep the values coming out reasonable, the sensor needs to be calibrated [245].
So the carbon dioxide sensor needs calibration also. Depending on the application, this can be accomplished by calibrating the sensor to a known gas or using the Automatic Baseline Calibration (ABC) method.
The most accurate method of CO2 sensor calibration is to expose it to a known gas (typically 100 % nitrogen) in order to duplicate the conditions under which the sensor was originally calibrated at the factory. ISO certification is available on high-end sensors to verify this process for medical or scientific purposes. Nitrogen calibration is also required if CO2 levels between 0 to 400 ppm will be measured. Due to the fact that fresh air has a typical CO2 level of about 400 ppm a measurement below is not required for us. The problem with calibrating using nitrogen is that is expensive and good equipment is required. A sealed calibration enclosure, a tank of pure nitrogen, and calibration software are required to match the original factory testing environment. Otherwise, the accuracy of the calibration cannot be ensured. For room air quality measurements this is not necessary. That's why the calibration is usually done by fresh air if the maximum accuracy is less important than costs.
Instead of calibrating at 0 ppm CO2 (with nitrogen), the sensor is calibrated at 400 ppm CO2 (outdoor air is actually 390 ppm), then 400 ppm is subtracted from the newly calculated offset value.
8.7.5 Interaction
For the interaction, we used the Microphone MAX4466. With the Microphone, we are getting a voltage over time signal. The serial monitor works with a Baud rate of 115200. The signal is read and mathematically logarithmically transferred into a dB signal. After the installation of the microphone two tests are followed: The calibration of the sensor and reaction to the baby crying. For both tests, the same experimental setup is used which is shown in Figure 88. The sound level meter “SC-30” sold by “CESVA”, the Microphone MAX4466 and a speaker are positioned under a transparent plastic box. A cardboard base is put beneath to minimize vibration and sound reflection. The sound level meter is connected to the computer. On the computer, the manufacturer software is installed which can measure the sound level in decibel and export the values in an Excel file. Furthermore, the speaker is connected with a function generator which creates constant Sinus noises. Amplitude and frequencies can be adapted. The microphone is connected with the Arduino IDE, where all measurements are shown over the time in the Serial Monitor and the Serial Plotter. During the measurements, the plastic box saves noise measurement from background noises. The integrating sound level meter Cesva Sc-30 has a Measurement range of 23 dbA to 137 dBA and is capable with frequencies of 10 Hz to 20 kHz. Within -10 °C to + 50 °C the maximum error is 0.5 dB [246].

The Output of the Microphone is filtered as you can see in Figure 89.
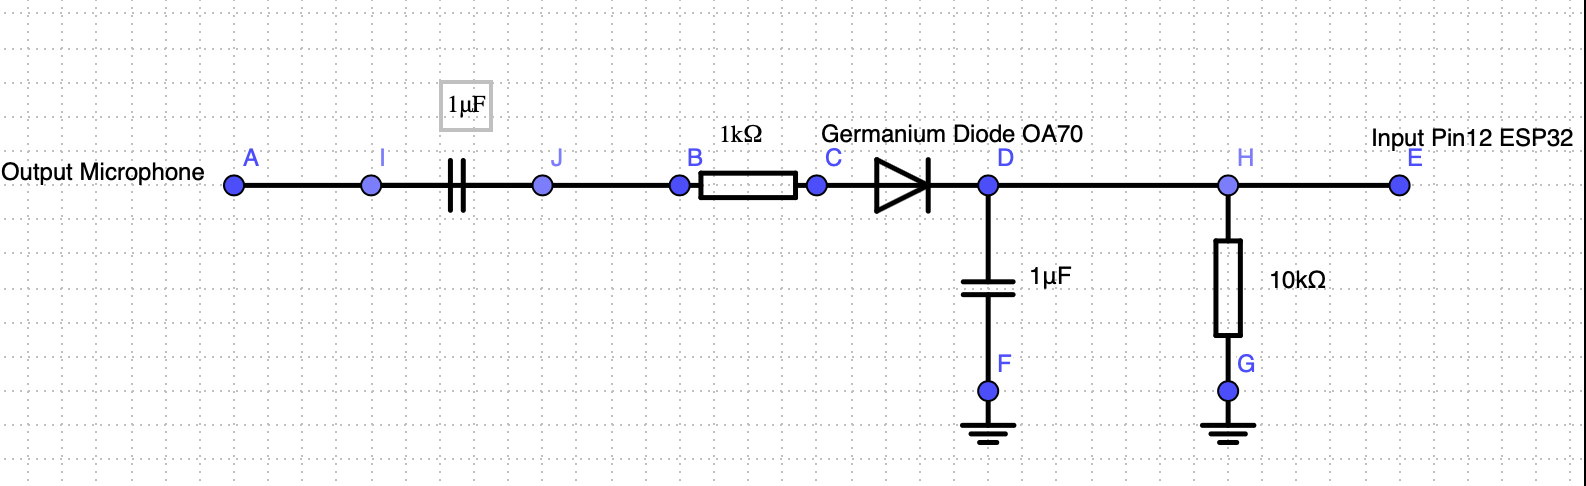
Having an AC sinus signal the diode cuts the sub wave due to its one-way permeability. The positive wave loads the capacitor and makes the signal fade much slower as you can see in Figure 90.

For calibrating the sensor a sound with a constant level is created with the function generator and the speaker. While creating the sound the sound meter measures the decibel. The microphone measures at the same the voltage level. Assuming that the sound meter decibel is linear to the voltage level, the output sound level in dB is calculated with this formula [247]:
\begin{equation} Output Sound Level= Sound Level Meter +20*\log_{10}({\frac{Sensititvity Sensor}{Output Sensor}}) (dBA) \end{equation}
If the microphone value is similar to the voltage level, the logarithm is zero and the sound level is equal to the decibel of the sound meter measurement. This offset added to the referenced formula.
A baby cry has a frequency range from 336.9 Hz to 502 Hz [248]. Due to that, the frequency stability of the MAX4466 is tested. In Figure 91 the noise level in dBA overtime for the two extreme frequencies can be seen. The reference graph is laid over the ones of the microphone. The lower the frequency gets the bigger is the deviation between these graphs. Due to the fact that our target is to create a cry detection and not an exact sonometer the deviations can be accepted. Because of that, we accept a deviation of ± 5 %. Within that range, a cry is still reliably detected. As an example, both extreme values are shown with the acceptance range in Figure 91. It can be seen that the measured extreme values for frequencies of 100 Hz and 500 Hz compared with the sound level meter with the acceptance range of 5 %.

After the calibration, the reaction to the baby crying is tested. The main target of the test is to figure out how fast the microphone can react to the infants’ noise and in which range of the noise level it measures in comparison with the sound level meter. Thus, a baby crying is simulated by a recording from YouTube [249]. The recording is played by a mobile phone which is added to the experimental setup. Moreover, the volume of the mobile phone is set up to the average range of a baby cry [250]. The microphone and the sound level meter have the same distance to the speaker of the mobile phone. During the measurement, the record is played four times and stopped between the passages.
Figure 92 shows the comparison of the sound level meter and the microphone with the sound level L in decibel dB over the time t in s. It stays clear that the sensibility of the sound level meter is much higher the sensibility of the microphone. As an example, the first measurement can be used. For the sound level meter, the range is between the maximum and the minimum is 16.5 dB. In comparison with the microphone of the pillow, the range is 3 dB. The reason for this observation can be the time for discharging of the compensator. Nevertheless, the average of the noise level of all four measurements is close. For the noise meter, the average of the baby crying is 90.82 dB and the average of the microphone is 92.0 dB. Also, the reaction of when the recording starts and stops is for both measurements similarly. As seen in Figure 92 a significant difference is not shown.

Consequently, it is demonstrated that the reaction to the crying of the baby and the measurement of the calibrated noise level is precisely enough to react to the crying of the baby. Even when the sensibility of the low-cost microphone is not high, the average of the crying is close to the value of the calibrated sound level meter. Furthermore, the reaction when the crying starts and ends has no important difference between the two devices.
Finally, the cry detection and the MP3 player can be programmed. Therefore, the minimum sound level is set to 80 dB. If the infant crying goes over this value the cry detection is initialized. Now a timer counts 2 seconds. When the sound level is still over 80 dB, a cry is detected. In this way, false alarms caused by small peaks are avoided. After a cry is detected up to three songs can be played on the MP3 player through the speaker. After three minutes the music stops. In this period the baby can calm down to the music. Meanwhile, the parents are notified by a push notification and can come to the infants’ bedroom to care for the baby. Nevertheless, the baby can go on crying after the period. For this reason, the cry measurement of the sound level is set on and the music can be played again.
8.7.6 IoT Platform Thingsboard
After installing and calibrating the sensors, the infrastructure of for the Bluetooth and Wi-Fi connection can be installed. Moreover, the open-source IoT platform ThingsBoard is selected. The website can manage different devices with a free community server. The connection to the devices occurs with a unique token for each device. Furthermore, the requirements for the real-time monitoring of the data and the notification for the parents can be realized in an interface. In the first step, the Bluetooth Low Energy (BLE) client is set up. This client is the microcontroller for the pillow and the sock. Figure 93 shows the flowchart of the Arduino code. On the left-hand side, the setup is installed. In the beginning, the baud rate is set to 115200. This step is needed to show the feedback of the microcontroller on the Serial Monitor in the Arduino software. After this, the BLE client is installed and start to search for the BLE server which is the microcontroller of the Home Station. Additionally, the pulse sensor and the microphone code is initialized to read the values. On the right-hand side is a loop circuit. It starts after the setup. It connects to the Bluetooth server, reads the values of the sensors and converts the values to a string. The unit of the pulse measurement is bpm. For the measurement of the baby crying only the values true and false are given. This binary status shows if the sound files are played with the MP3 player. This string is sent as a message to the Bluetooth server. This procedure happens every 10 s.

The installation of the BLE client is followed by the installation of the BLE server on the microcontroller of the Home Station. Figure 94 shows the flowchart of the Arduino code. It starts with the setup. First, the unique tokens for each device for the ThingsBoard connection and the WiFi is fixed. Additionally, the baud rate is set for the feedback of the microcontroller. After this step, the BLE server, the WiFi and the sensors are started. On the right side, the coding of the loop circuit is shown. It reads the values of the home station sensors, receives the values of the BLE client. Both steps are done separately. In this way, the Home Station can only send the environment values without measuring the baby status. Afterwards, the Home Station connects to the Thingsboard server by Wifi and sends all sensor values to Thingsboard divided by the different tokens of the devices. After this step, the loop starts again after ten seconds.

Finally, the interface for monitoring of the data collection on ThingBoard is designed. Therefore, the dashboard is developed. It is public and is available under this link. The initial dashboard interface is shown in Figure 94. It displays all current values of the sensor divided by the features of bGuard. Thus, the parents can have a first overview of all parts of the bGuard product. When the parents want to see more detailed information about the devices they can click on the detailed symbol on the right top of each sensor box. Consequently, the detail window of the device is opened.

Figure 96 shows the detail page for the example of the room temperature. On the top, the current room temperature is shown in the form of an analogue gauge. Furthermore, the room temperature history is shown in a temperature-real-time diagram. The real-time axis can be edited manually on the right top of the dashboard. In Figure 96 the axis is set to one hour. For this period the minimum, maximum and average temperature are documented in the right bottom of the diagram. On the button of the page is an alarm window. It shows all the notifications of the sensor. Moreover, the minimum and maximum temperature range can be edited on the left-hand site. When the room temperature is out of the given range, the alarm gives a notification. This reaction is realized by the Rule Engine which is part of ThingsBoard. For testing the notification a high room temperature is created. As seen in Figure 96, the alarm gives the notification. The test proves the functionality of the edited temperature range in combination with the alarm. Furthermore, the privacy settings for the dashboard can be set. In this way, only the parents can see the status of their child.

During the implementation of the dashboard, there was an issue with the connectivity to the ThingsBoard server. Sometimes the team was not able to log in on the ThingsBoard demo server. One reason can be that the ThingsBoard team is still working on improving their servers and shut them down for a period. Nevertheless, it was a good decision to use ThingsBoard. The scope of the open-source platform is very big in comparison with other suppliers. With the Rule Engine, the alarm can be realized. Moreover, the amount of the used sensor devices is not limited and the Dashboard for the data collection and visualization is developed in a modern way. Another advantage is that the privacy of the parents and the child is saved.
8.8 Conclusion
In the Project Development chapter, the progress of the building of the prototype was explained. Having Sketches, Structural Drafts or a first cardboard model the product was concretized. Also, the technical requirements like schematic drawings of the microelectronics were discussed, decided and implemented. The Structural Drafts of the home station, as well as the printing process, was shown, and materials were decided. In the Functional Specification chapter, the user stories were transferred into technical requirements and acceptance criteria were designed to assure quality in the end. Also, testing status and a deviation report were implemented in this table. The designs of the parts of the prototype or the software of the application/IoT Platform were concretized. Also, software security requirements and regulations were stated. In the Development chapter, the process of the home station development is presented. Also, Microelectronics were compared and decided. Finally, in the tests and results, chapter Software and hardware were tested, calibrated and analyzed.
The chosen materials and components are following the requirements of ethics and sustainability. Also, they fit in the budget with the help of supporters and sponsors. The concept and design are following the requirements. An application interface shows, how the customer can see the measured values. Furthermore, the analyzation of the home station and casings proof that bGuard is resistant for normal life use and functionality in normal use is verified. The test graphics which are presented prove that a proper realization is done. The IoT platform monitors the values in a dashboard and alarms the user if the measurements are out of the range.
In the next chapter, the project itself and the prototype will be concluded. Also, the project development is further described, and future developments will be presented.
9. Conclusions
At the beginning of the EPS 2019, the team defined the requirements and objectives for the Smart Companion Pillow. After the definition of the project, the team searched for the target group in the State of the Art. Followed by Project Management. The chapter was a tool to keep an overview of the time, costs and risks. Furthermore, the Scrum method was used. In the agile way of organizing the group was weekly supported to divide the tasks and improve the way of working with the Sprint Evaluation. In the marketing chapter, the market was analysed for developing a selling strategy with the defined product, price, place and promotion. Moreover, the team thought about sustainability and ethics. In the next step, the concept of the product and the prototype was developed. For the proof of the concept tests with the prototype are done and results were generated.
Finally, this chapter discusses which of the initial objectives are achieved. In the end, a view of future development is given.
9.1 Discussion
The EPS program provided a unique experience for the team members. With the different fields of subjects and cultural backgrounds, each team member could learn from each other to create the concept prototype of the product bGuard. The time was limited and the budget was 100.00 €. Therefore, each team member worked engaged. Also, the team had help from sponsors and supporters to develop the prototype.
The main initial objective of the smart pillow was the stress relief for the parents after birth. For this target, the team designed the prototype which monitors the baby's health and the environment. Furthermore, cry detection and reaction were included. The health is measured by the pulse sensor which is included in a sock. During the period of the 24 months, the infant is growing. Thus, the size of the sock is adjustable. The prototype was printed with the 3D printer and the textile is sewed over it by hand. In cases of cleaning the sensor can be put out of it. To low the risk of SIDS the team designed a pillow with two side bumpers. Thereby the infant is prevented from lying on its tummy. Like the sock, the size of the pillow can be adjusted too. Moreover, cry detection is realized by the microphone which can measure noise changes next to the baby. An MP3 player plays music through a speaker to calm down the crying of the baby. Both components are positioned in the pillow and can be removed from the pillow when the cover of the pillow has to be cleaned. The environment of the baby and the parents are realized in the Home Station. It can measure the room temperature, relative humidity and carbon dioxide in the room. The station itself is printed with the 3D printer. All the components are positioned without warming influences of the other electronic parts. The measured values are monitored on the open-source IoT platform ThingsBoard. In a dashboard, the history of every measurement and the alarm is shown visually and intuitive for the customer. The design for an application is also done.
Besides the production of the prototype, a professional promotion had to be developed. Therefore all the benefits of the product are advertised with a poster, a leaflet, a video and a manual.
During the installation of the sensors, the team worked with the Arduino IDE. No team member had experience in programming in this way. Therefore, the installation was a challenge for the team. Moreover, the quality assurance of the sensor values and the installation of ThingsBoard had to be achieved. Finding the right material for the cover of the pillow and the sock was also a challenge because of the ethical and sustainable requirements.
Taking everything into account, the team realized every initial objective. Moreover, the team is confident that bGuard has the potential to become a real product in the market due to its unique combination of features that lower the risk of SIDS, monitor the quality of the sleeping environment and reduce parenting stress.
9.2 Future Development
In this project, the team did the best to develop the bGuard as enhanced as possible. However, the team was constrained by some factors. The team had limited money resources, time and sometimes had a lack of knowledge on certain fields needed for further development. This means that improvements can always be made.
For instance, there is an attenuation due to the microphone sensor being placed in the pillow and as this affects the signal further tests would be needed in the future.
Also bGuard mobile application is one of the things that need further development. The team had an idea of what the app should look like and what data it should provide but were only able to design the interface. The application is now merely a concept. Moreover, the team was not able to develop a real app in the given time. For example, now bGuard is limited to sending an audio file to the Smart Pillow but in the future, the team would like to expand this to a communication feature which allows the parents to talk to the baby.
Additionally, the tests can be improved. The simulation in SOLIDWORKS by taking into account the calculation of the force (based on the real weight of the home station including all the components) as also the pressure. Now, the tests has been done with assumptions of real life examples. Also, the tests of the sensors and their aim can be improved.
Furthermore, the team would make our bGuard comply with the regulations of being a medical device. This would help to position the bGuard as a trustworthy device and help make bGuard to a market leader.
Finally, the team would focus on using smaller and more precise electronic components. This way they will take in less space and become more accurate results. The given budget made these things difficult to realize during the project.